For most of digital assets' short history, “index” has meant “basket weighted by market capitalization.” That's a measure of belief, of how much capital has decided to bet on an asset, not a measure of whether anything underneath that bet is actually working. For a long time, that was fine, because the tools to measure the alternative barely existed.
That's no longer true. Onchain data now makes it possible to rank a protocol the way an equity analyst ranks a company: by what it earns and who's using it. MarketVector built an index around exactly that idea in December 2023: the MarketVector™ Token Terminal Fundamental Index (MVTT10F), part of a two-index suite built jointly with Token Terminal. Both indexes in the suite select their constituents the same way, ranked by fees and active users. They diverge only in how those constituents are weighted: MVTT10F weights by that same double-ranked fundamental score, square-rooted to control concentration, while its sibling, MVTT10M, weights the identical selection by market capitalization instead. This piece is about MVTT10F specifically, because it's the one built to anticipate a shift the rest of the industry is only now starting to price in: that the durable signal in digital assets is fees and usage, not size.
Why Fundamental Crypto Indexes Are Gaining Traction in 2026?
The case for fundamentals-based weighting isn't theoretical anymore; it's showing up in the scale of what's actually moving onchain.
Stablecoins alone settled roughly $80 trillion in transfer volume in 2026 year-to-date, putting them on an annualized run rate north of $130 trillion. For context, Visa processed $16.7 trillion in total volume in fiscal 2025, and Mastercard $10.6 trillion in gross dollar volume over calendar 2025; combined, still only around a fifth of what stablecoins are now moving in a single year.
Figure 1: On-Chain Fundamentals Have Outgrown the Narrative Around Them
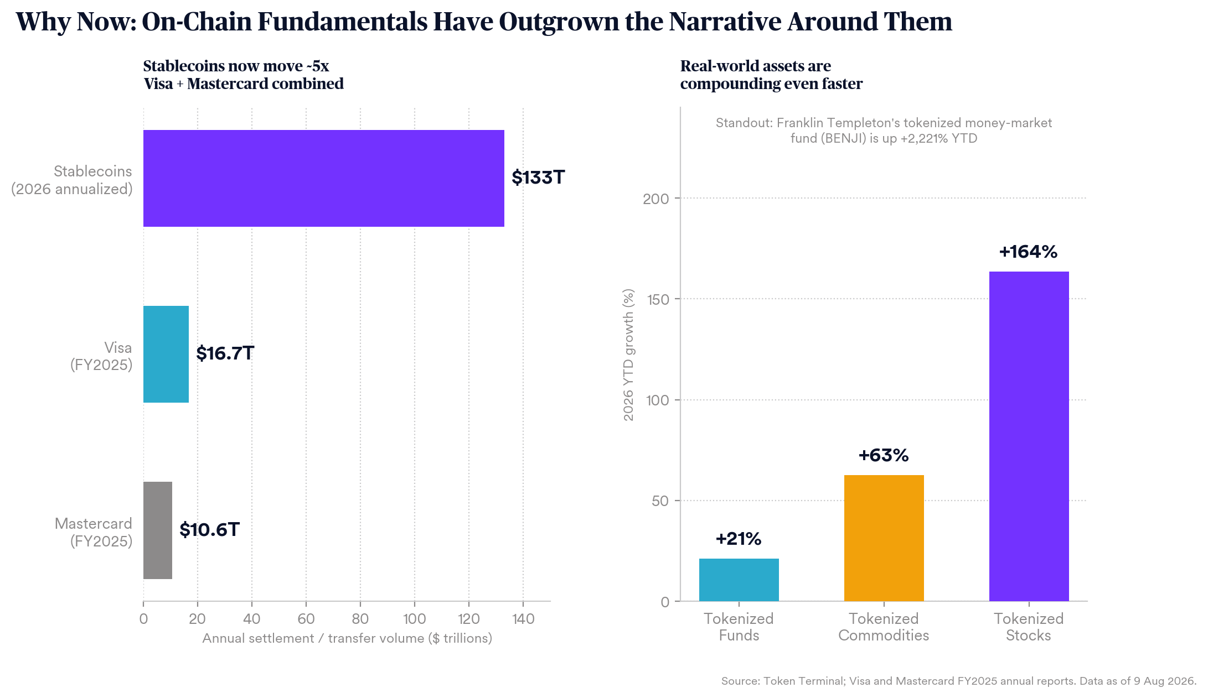
Some of that onchain volume is bot activity and internal rebalancing rather than retail spend, but even generously discounted, the scale is no longer a rounding error next to legacy payment rails. It's the majority of it.
The economics behind that volume are just as striking. Tether generated an estimated $5.2 billion in revenue in 2025 off a stablecoin float held onchain, with a headcount in the hundreds rather than the tens of thousands a business of that scale would typically require. Stablecoin holders now number close to 188 million unique addresses, already approaching half the scale of PayPal's ~427 million active accounts.
And the growth isn't confined to stablecoins. Tokenized real-world assets (stocks, funds, commodities) are compounding even faster off a smaller base. Tokenized stocks are up 163% year-to-date in 2026. Franklin Templeton's tokenized money market fund, BENJI, has grown its onchain AUM by roughly 2,200% since January. These aren't speculative token launches; they're regulated financial products moving onto public blockchains because the infrastructure now supports it.
None of this shows up in a market-cap chart. A protocol settling a growing share of $80 trillion in stablecoin flow and a protocol whose token is up 20% on narrative look identical to a cap-weighted index, until you weight by what each one actually does. That's the gap fundamentals-based indexing is built to close, and it's the reason the idea is suddenly getting attention across the industry, not just from us.
How MVTT10F is Built
The mechanics are deliberately simple. Each month, MVTT10F ranks its eligible universe on two onchain metrics sourced from Token Terminal: fees paid by end-users (the gross amount users pay to use a protocol, weighted 80%) and daily active users (adoption, weighted 20%), both smoothed with rolling 30-day averages so a single spike doesn't distort the ranking. Weights are then allocated using a root-weighted methodology, not a simple fee-share split, specifically to prevent one dominant protocol from swallowing the rest of the index. The result rebalances monthly, replacing constituents that fall out of rank with the next-highest eligible name, automatically and without discretionary override.
That's the whole idea: rank by what's actually earned, dampen the concentration that ranking would otherwise create, and let it update every month as the underlying economics shift.
The Performance Record: An Honest Look
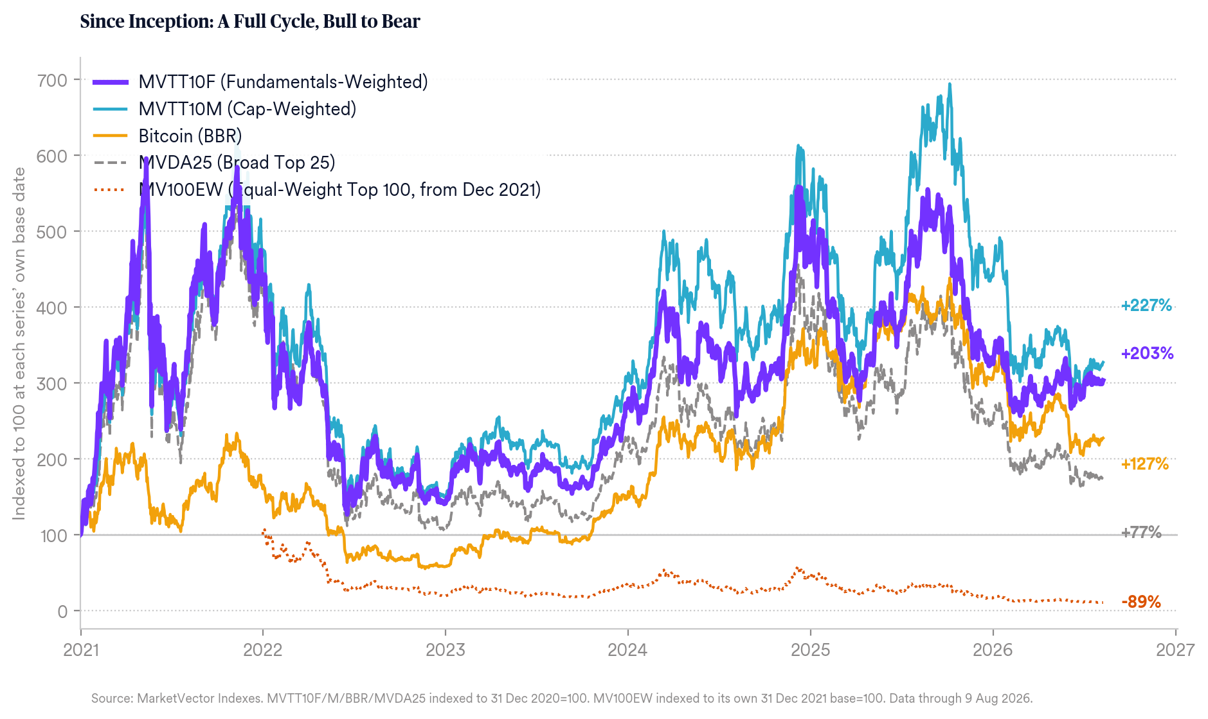
Since the index's base date of 31 December 2020 through 9 August 2026, MVTT10F has returned +203% cumulatively, a 21.9% CAGR, with a Sharpe ratio of 0.64. That's not a guarantee that fundamentals-weighting wins every quarter: in a pure, broad-based melt-up led by the largest names, it can lag a simple bet on size, since it's structurally underweight exactly those names. But measured against the passive alternatives an allocator would otherwise default to, the record over a full bull-to-bear cycle is decisive.
Figure 2: A Full Cycle, Bull to Bear
What it decisively beats is the passive alternative an allocator would otherwise default to.
+127% cumulative return, Bitcoin (BBR), 15.8% CAGR, Sharpe 0.54
+77% cumulative return, broad top-25 basket (MVDA25), 10.7% CAGR, Sharpe 0.49
–89% cumulative return, equal-weight top-100 basket, Sharpe –0.38
That comparison is the real point. Fundamentals-weighting is what turns a broad, diversified basket of digital assets into something an allocator can actually hold, by systematically avoiding the dead weight that destroys an equal-weighted or purely cap-weighted approach to the same universe.
The 2026 Stress Test
Where MVTT10F's design has genuinely earned its keep is in this year specifically. 2026 has been a real drawdown across digital assets, and the divergence between a fundamentals-weighted approach and everything else has been stark. Year-to-date through 9 August:
–7.6% MVTT10F
–25.9% MVTT10M (cap-weighted sibling)
–25.4% Bitcoin (BBR)
–27.7% MVDA25 (broad top-25)
–34.3% MV100EW (equal-weight top-100)
Every comparison line fell by roughly a quarter to a third of its value this year. MVTT10F fell by less than 10%. MV100EW is worth dwelling on specifically: as an equal-weighted basket of the top 100 digital assets, it's a reasonable proxy for how altcoins broadly have traded this year, stripped of the size-weighting that lets a handful of large names flatter a cap-weighted number. A 34% decline in that proxy is a blunt statement about how bad altcoin performance outside the largest few names has actually been in 2026.
Figure 3: 2026 Drawdown Fundamentals Held Up Where Size Didn't
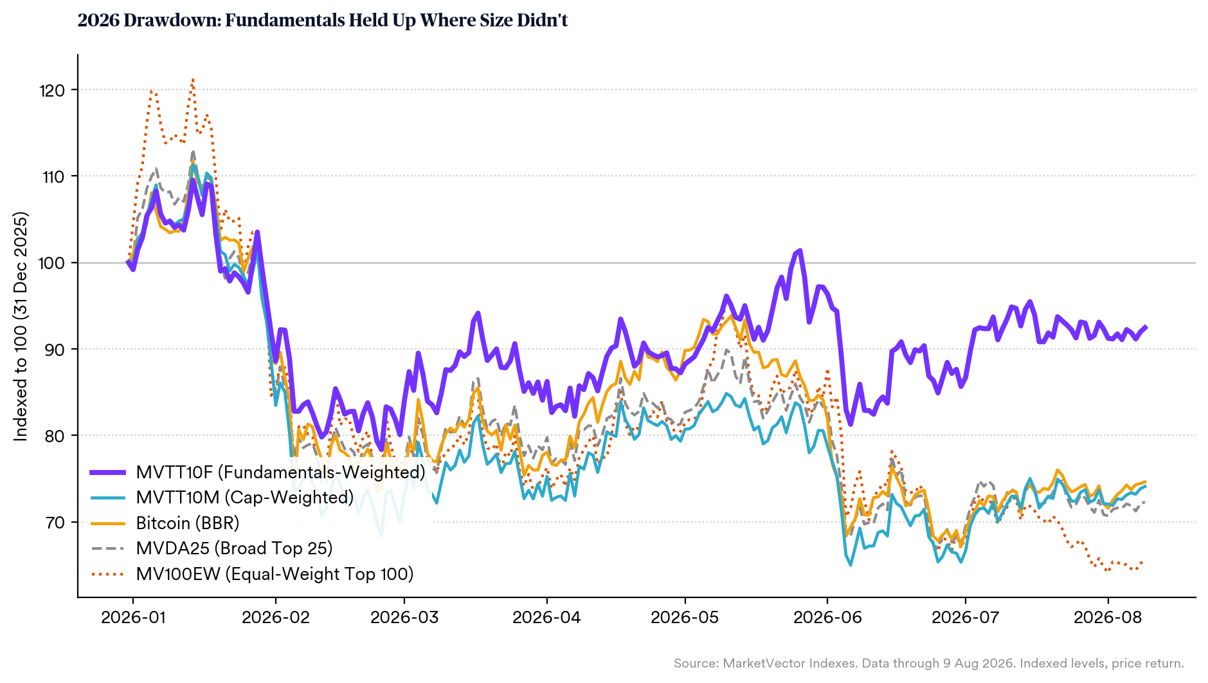
The chart tells the story better than the numbers alone. MVTT10F tracks the broader market tightly through the January selloff, then visibly decouples through the rest of the year, briefly pushing back above its starting level in late May, while every cap-weighted comparison stayed underwater the entire time.
Under the Hood: Why it Held
The resilience isn't a black box. Three specific, verifiable mechanisms drove it.
TRON has anchored the index because it's anchoring the stablecoin economy. TRON has held a stable 26–29% weight in MVTT10F through the year, by far its largest position. Onchain data shows why: TRON generates roughly $7.4 million per day in protocol fees, the large majority of it from USDT settlement, a direct line back to the stablecoin volume figures above. TRON's dominant index weight is, quite literally, the stablecoin boom showing up in fundamentals data.
The largest weights by fundamentals were also this year's best performers. TRON and Hyperliquid, the two names the fees-and-active-users ranking has weighted most heavily through 2026, were also, by a wide margin, MVTT10F's two best-performing constituents by price this year. The methodology isn't selecting for price; it's selecting for fees and users. This year, those turned out to be the same names.
Figure 4: Weight is Fluid: It Follows Fees & Users, Not Price
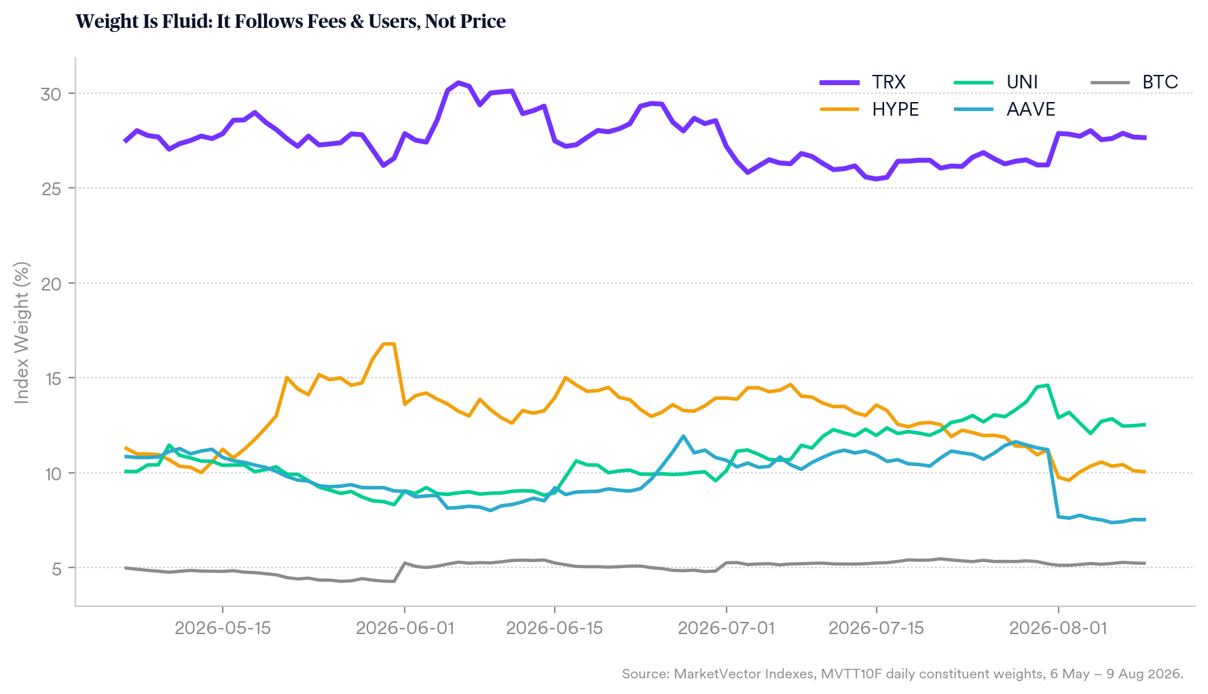
Uniswap is the mirror image. UNI is the one name in this group with genuinely improving fundamentals: fees up roughly 17% and active users up a similar amount over the same period. Its index weight rose in step, from around 8% to nearly 15%, the single largest weight gain in the index.
The mechanics also simply worked as designed: Polygon Ecosystem Token exited the index and Morpho entered on schedule at the end of July, the monthly review-and-replace process executing cleanly with no manual override required.
The Bitcoin Question, Answered by Weighting, Not Exclusion
Some newer approaches to fundamentals-based crypto investing have chosen to exclude Bitcoin entirely, on the argument that it's a monetary asset rather than a productive one. MVTT10F takes a different position: it doesn't need to exclude Bitcoin to solve that problem, because the methodology already answers the question on its own terms, and the two-and-a-half-year record now available shows it has done so consistently, not just recently.
Within this ten-name universe, Bitcoin's own market capitalization has run at roughly 70–80% of the combined total throughout the index's history, currently around 76%. A simple market-cap weighting would hand Bitcoin something close to that share. MVTT10F never has: even at its peak, right at launch in late 2023, Bitcoin's weight topped out in the high teens, nowhere near its true market-cap share, and it has declined in an almost uninterrupted slide since, to around 5% today, as the fees-and-active-users ranking progressively shifted weight toward protocols whose real onchain activity was growing faster than Bitcoin's. TRON is the clearest counterpoint, moving in almost a mirror image: from the high teens in 2023 to a stable 25–28% range by 2025–26, tracking its emergence as the dominant settlement rail for stablecoin transfers.
Ethereum tells a related but distinct story. Its weight has fallen almost as steadily as Bitcoin's, from a peak near 22% in early 2024 to around 7% today, but the driver isn't a monetary-asset argument, it's cannibalization. As more Layer 2 networks spun up and matured through 2024 and 2025, they pulled a growing share of transaction activity and fees off Ethereum's own base layer and onto themselves, even as the broader Ethereum ecosystem kept growing. The ranking doesn't distinguish between a chain losing relevance and a chain losing fees to its own scaling roadmap; it simply weights what generates fees and users today, and mainnet Ethereum has been generating a shrinking share of both.
Figure 5: Two Years of Rebalancing BTC's Role Has Shrunk as Stablecoin Settlement Grew
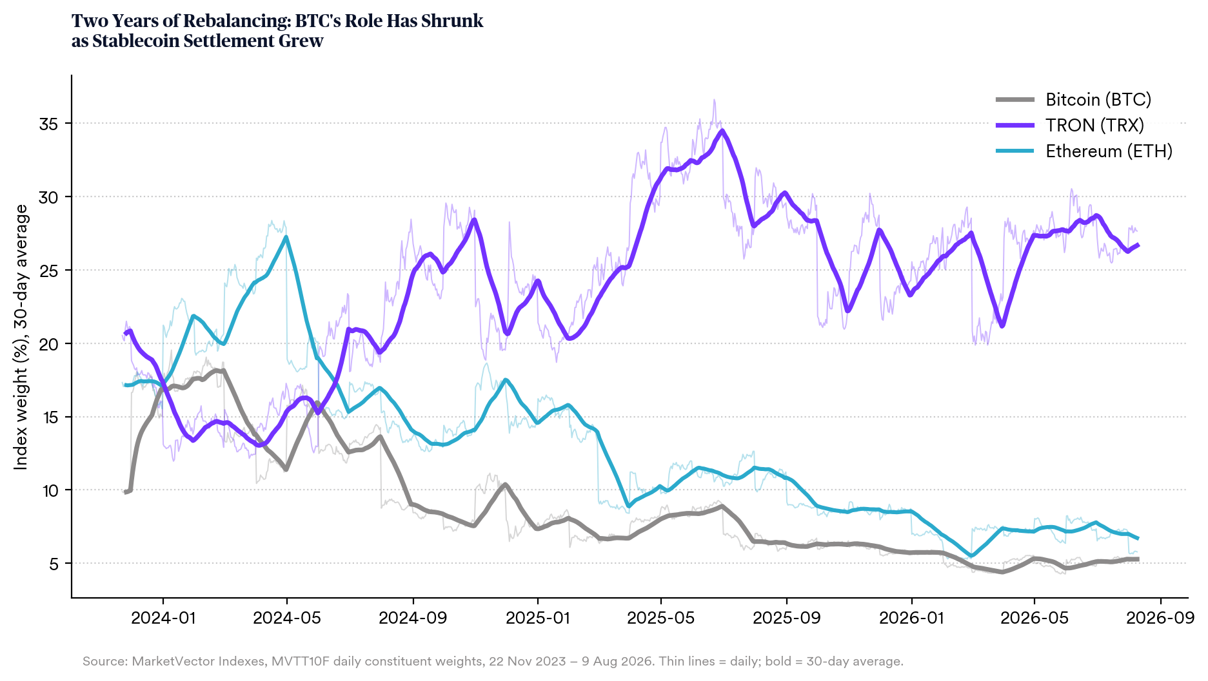
No exclusion rule was needed to get there. The ranking did the work, gradually, month by month, as the chain landscape it measures actually changed underneath it.
Full Transparency: The Composition in the Open
None of the preceding sections work as a claim unless the composition behind them is fully visible. As of 9 August 2026, MVTT10F holds ten names, and every one of their weights is published daily, not just the top holdings, and not just at rebalance.
Table 1: The Ten Names
Protocol |
Symbol |
Market Cap |
FDV |
Fee (30d) |
Active Users (30d) |
MVTT10F Weight |
|---|---|---|---|---|---|---|
TRON |
TRX |
$31.4B |
$31.4B |
$224.3M |
3,950,074 |
27.6% |
Uniswap |
UNI |
$2.5B |
$3.5B |
$50.0M |
111,489 |
12.5% |
Hyperliquid |
HYPE |
$12.2B |
$52.6B |
$44.0M |
66,106 |
10.1% |
Solana |
SOL |
$44.2B |
$48.0B |
$15.5M |
2,016,791 |
9.7% |
BNB Chain |
BNB |
$79.7B |
$79.7B |
$11.4M |
3,358,306 |
9.3% |
Morpho |
MORPHO |
$1.3B |
$1.9B |
$34.2M |
903 |
8.4% |
Aave |
AAVE |
$1.4B |
$1.4B |
$29.7M |
4,821 |
7.5% |
Ethereum |
ETH |
$225.8B |
$225.8B |
$7.8M |
502,523 |
5.8% |
Bitcoin |
BTC |
$1,282.7B |
$1,282.7B |
$6.0M |
459,293 |
5.2% |
Near |
NEAR |
$2.1B |
$2.1B |
$3.9M |
201,469 |
3.8% |
Source: Token Terminal (Market Cap, FDV, Fee (30d), Active Users (30d), average daily active addresses over the trailing 30 days, as of 10 Aug 2026); MarketVector Indexes (MVTT10F Weight, as of 9 Aug 2026).
Not every provider in the fundamentals-investing category discloses its methodology or its resulting weights at this level of granularity; some treat the exact ranking formula, or the composition it produces, as proprietary. MarketVector's approach is the opposite: the full ranking mechanics are published in the Index Guide, and the resulting constituent list and weights are disseminated daily for MVTT10F and every other index in the suite. An allocator evaluating this approach doesn't have to take the output on faith; the full working is available to check.
Where This Goes From Here
The broader industry is now visibly moving toward the same underlying question MVTT10F was built to answer: does a protocol generate real economic value, and does that value reach the people who hold its token? That validation matters less as a competitive point and more as a signal that the center of gravity in how this asset class gets measured is shifting: from what the market believes an asset is worth, to what it can be shown to actually do.
That's the case for why a fundamentals-weighted, monthly-rebalanced index like MVTT10F ages well rather than just performing well in one difficult year: it doesn't need to be redesigned every time the market's center of gravity moves, because the methodology is already built to follow wherever the real activity goes next.
Data sources: MarketVector Indexes (index-level and constituent-level data, all indexes measured on a price-return basis) and Token Terminal (protocol fee, revenue, active-user, stablecoin, and real-world-asset data). All figures current as of 9 August 2026 unless otherwise noted.Data sources: MarketVector Indexes (index-level and constituent-level data, all indexes measured on a price-return basis) and Token Terminal (protocol fee, revenue, active-user, stablecoin, and real-world-asset data). All figures current as of 9 August 2026 unless otherwise noted.
About the Author(s):
Martin Leinweber leads digital asset research and strategy at MarketVector Indexes, where he develops index products, publishes institutional research, and serves as the firm's primary voice on crypto markets to a global client base. His work sits at the intersection of systematic investing and an emerging asset class, translating rigorous quantitative frameworks into actionable insight for institutional investors. Before joining MarketVector, Martin spent nearly two decades as a Portfolio Manager across equities, fixed income, and alternative investments. At Quoniam Asset Management, one of Germany's foremost quantitative houses, he managed active funds for institutional clients including insurance companies, pension funds, and sovereign wealth funds. Earlier in his career at MEAG, the asset manager of Munich Re and ERGO, he contributed to the firm's international expansion, including the establishment of a joint venture with PICC, China's largest insurance company, with operations in Shanghai and Beijing. Martin is co-author of two Wiley publications: Asset-Allokation mit Kryptoassets: Das Handbuch (2021), the first institutional handbook on integrating digital assets into traditional portfolios, and Mastering Crypto Assets: Investing in Bitcoin, Ethereum, and Beyond (2024). He holds a Master of Economics from the University of Hohenheim and is a CFA Charterholder.
IMPORTANT DEFINITIONS AND DISCLOSURES
Copyright © 2026 by MarketVector Indexes GmbH (‘MarketVector’) All rights reserved. The MarketVector family of indexes (MarketVectorTM, Bluestar®, MVIS®) is protected through various intellectual property rights and unfair competition and misappropriation laws. MVIS® is a registered trademark of Van Eck Associates Corporation that has been licensed to MarketVector. MarketVectorTM and MarketVector IndexesTM are pending trademarks of Van Eck Associates Corporation. BlueStar®, BlueStar Indexes®, BIGI®, and BIGITech® are trademarks of MarketVector Indexes GmbH.
Redistribution, reproduction, and/or photocopying in whole or in part are prohibited without written permission. All information provided by MarketVector is impersonal and not tailored to the needs of any person, entity, or group of persons. MarketVector receives compensation in connection with licensing its indexes to third parties. You require a license from MarketVector to launch any product that is linked to a MarketVectorTM Index to use the index data for any business purpose and all use of the MarketVectorTM name or name of the MarketVectorTM Index. The past performance of an index is not a guarantee of future results.
It is not possible to invest directly in an index. Exposure to an asset class represented by an index is available through investable instruments based on that index. MarketVector does not sponsor, endorse, sell, promote, or manage any investment fund or other investment vehicle that is offered by third parties and that seeks to provide an investment return based on the performance of any index. MarketVector makes no assurance that investment products based on the index will accurately track index performance or provide positive investment returns. MarketVector is not an investment advisor, and it makes no representation regarding the advisability of investing in any such investment fund or other investment vehicle. A decision to invest in any such investment fund or other investment vehicle should not be made in reliance on any of the statements set forth in this document.
Investments into cryptocurrencies and/or digital assets are subject to material and high risk including the risk of total loss. The calculated prices may not be achieved by investors as the calculated price is based on prices from different trading platforms. Furthermore, an investment into cryptocurrencies and/or digital assets may become illiquid depending on the trading platform or investment product used for the specific investment. Investors should carefully review all risk factors disclosed by the relevant trading platform or in the product documents of relevant investment products.
Prospective investors are advised to make an investment in any such fund or other vehicle only after carefully considering the risks associated with investing in such funds, as detailed in an offering memorandum or similar document that is prepared by or on behalf of the issuer of the investment fund or other vehicle. The inclusion of a security within an index is not a recommendation by MarketVector to buy, sell, or hold such security, nor is it considered to be investment advice.
All information shown prior to the index launch date is simulated performance data created from backtesting ("Simulated past performance”). Simulated past performance is not actual but hypothetical performance based on the same or fundamentally the same methodology that was in effect when the index was launched. Simulated past performance may materially differ from the actual performance. Actual or simulated past performance is no guarantee for future results.
These materials have been prepared solely for informational purposes based upon information generally available to the public from sources believed to be reliable. No content contained in these materials (including index data, ratings, credit-related analyses and data, model, software, or other application or output therefrom) or any part thereof (Content) may be modified, reverse-engineered, reproduced or distributed in any form by any means, or stored in a database or retrieval system, without the prior written permission of MarketVector. The Content shall not be used for any unlawful or unauthorized purposes. MarketVector and its third-party data providers and licensors (collectively “MarketVector Parties”) do not guarantee the accuracy, completeness, timeliness, or availability of the Content. MarketVector Parties are not responsible for any errors or omissions, regardless of the cause, for the results obtained from the use of the Content. THE CONTENT IS PROVIDED ON AN “AS IS” BASIS. MARKETVECTOR PARTIES DISCLAIM ANY AND ALL EXPRESS OR IMPLIED WARRANTIES, INCLUDING, BUT NOT LIMITED TO, ANY WARRANTIES OF MERCHANTABILITY OR FITNESS FOR A PARTICULAR PURPOSE OR USE, FREEDOM FROM BUGS, SOFTWARE ERRORS, OR DEFECTS, THAT THE CONTENT’S FUNCTIONING WILL BE UNINTERRUPTED OR THAT THE CONTENT WILL OPERATE WITH ANY SOFTWARE OR HARDWARE CONFIGURATION. In no event shall MarketVector Parties be liable to any party for any direct, indirect, incidental, exemplary, compensatory, punitive, special, or consequential damages, costs, expenses, legal fees, or losses (including, without limitation, lost income or lost profits and opportunity costs) in connection with any use of the Content even if advised of the possibility of such damages.
Get the latest news & insights from MarketVector
Get the newsletterRelated:
Most popular
-
 Commentary
How Rising Rates Can Impact Equity Returns
-
 Commentary
The Space Economy Is Taking Off