
Executive Summary
The problem.
Perpetual markets never close. The equities they increasingly want to reference (AI leaders, defense primes, US-listed China plays, the broader innovation complex) have only ever been priced for a fraction of the week. That mismatch is now a blocker, not a theoretical one. When a derivative needs a mark price at 3am on a Wednesday and the underlying market is dark, something has to fill the gap. Left unmanaged, that something is usually a thin order book or ad hoc internal logic: neither independent, both fragile. The real decision for any exchange building this product is not whether to solve that gap, but whether to build the pricing and index infrastructure itself or license it already built.
Who has this problem.
Perpetual venues are the most visible case, not the largest. The same gap sits underneath any fund whose holdings are dark during its own trading session. A semiconductor ETF listed in Seoul, an S&P 500 tracker listed in Tokyo, a Japan fund listed in New York: in each case the calculation agent has to publish an intraday NAV for a basket that is not trading, and the authorized participants and market makers quoting that fund have to hedge exposure for which no matching instrument is open. Swap dealers meet the same problem from the other side of the trade. Today all of them solve it with a proxy, and they pay for the proxy in wider spreads, larger reserves and tracking error. Continuous, governed reference pricing is infrastructure for the regulated ETF ecosystem before it is infrastructure for anything crypto-native.
The solution.
Pyth Network sources and aggregates equity pricing continuously across the trading week, including the overnight session most single-exchange feeds don't cover, through its direct-publisher network and including its Blue Ocean ATS collaboration. MarketVector converts that continuous input into a governed, licensable index: eligibility rules, weighting, corporate-action treatment, market-disruption and fallback procedures, published methodology, and identifiers a venue can actually list against. Neither layer replaces the other. A venue needs both before it can put client margin against the number, and both are already built.
The incumbent.
None of this displaces index futures. Futures remain the deepest and best governed way to move broad equity risk overnight, and any honest account of this market has to start there. What they cannot do is cover exposures for which no contract exists or produce a level of a cash basket rather than a level of a contract. Those two limits define the gap this infrastructure fills, and Section 5 measures how wide it is.
Table 1: Who does what
Pyth |
MarketVector |
Exchange |
Price sourcing |
Index methodology |
Product listing |
Aggregation |
Governance |
Margin & risk framework |
Overnight data (Blue Ocean and firms quoting on BOATS) |
Corporate actions |
Market making |
Publisher network |
Rebalances & fallbacks |
Client distribution |
Who does what: Pyth prices it, MarketVector™ governs and calculates it, the exchange lists and distributes it.
The proof.
This is running today, not a proposal. Five MarketVector equity indexes, three thematic baskets (AI 10, China 10, Defense 10) and two broad indexes (Innovators 100, Top 500 US), operate on this infrastructure and underlie live perpetual-style equity index futures on Coinbase, a regulated US exchange and the first venue to deploy this structure. This paper backs that claim with our own data, not just the announcement: real Pyth-sourced feeds tested against tokenized 'always-on' proxies for the same underlying stocks, across an ordinary week, an actual earnings gap, and a full weekend. The results are stark. Governed continuous pricing holds together when it matters; non-benchmark, always-on pricing quietly comes apart.
The opportunity.
Coinbase was the first venue to deploy this structure, not the only one it was built for. The same Pyth-MarketVector framework supports custom thematic baskets, and bespoke methodology builds for any exchange or trading venue with the same reference-price problem. Section 7 walks through exactly what that engagement looks like, from defining the exposure to a listed, continuously-priced product.
1. Markets Don’t Close Anymore
There used to be a rhythm to markets. The bell rang, the week ended, and everyone could step away until Monday. That rhythm is gone. Perpetual exchanges list equity, commodity and FX perpetuals and keep them open around the clock. Prediction markets run continuously. Tokenized stocks trade through the weekend. The trading has already moved to 24/7; the pricing infrastructure underneath it has not caught up.
A US-listed stock is only actively priced on its primary exchange for about 19% of the week. Extend to the US pre- and post-market session and you reach roughly 48%. Even a full 24/5 feed, the standard MarketVector and Pyth already deliver into Coinbase's baskets today, tops out at 71%, because the exchanges it's built on genuinely go dark from Friday evening to Sunday evening.
Figure 1: How much of the week is actually priced
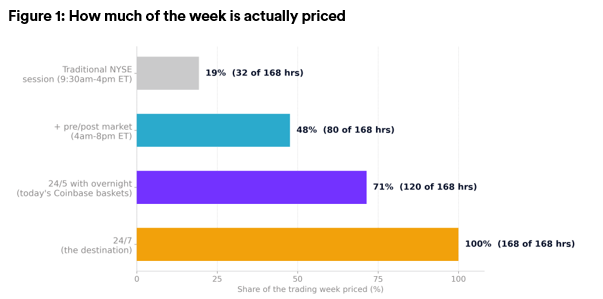
Share of the trading week that is actually priced, by market-hours regime. A perpetual future trades through all of it regardless.
For an exchange running perpetual-style products, that gap is not cosmetic. Every hour without an independent reference price is an hour where the exchange either marks its own book, which is exactly the kind of self-referential pricing that invites manipulation and cascading liquidations, or builds bespoke internal logic that no counterparty can audit. Pyth's own framing of this launch put it plainly: when a contract needs a price at 3am on a Wednesday, there is no true pause button, and there are no good options that don't involve an independent feed.
Institutional grade, 24/7 markets are becoming the standard. Tools like this help fill the critical infrastructure gaps that make this next era of markets possible.
- Boris Ilyevsky, Head of Derivatives at Coinbase
Zooming into a single trading day makes the mechanics concrete. A standard index only has a number during the main session. The continuous price underneath MarketVector's 24/5 index is actually stitched together by Pyth, from four distinct sessions, pre-trade, main session, post-trade and overnight, sourced through its direct-publisher network and its exclusive Blue Ocean ATS overnight collaboration. MarketVector's role is what sits on top of that continuous feed: index construction, governance and calculation, to benchmark standard, Monday through Friday. The one boundary that remains today is the weekend itself, which is exactly the frontier this paper returns to in Section 4.
Figure 2: How the index is actually built
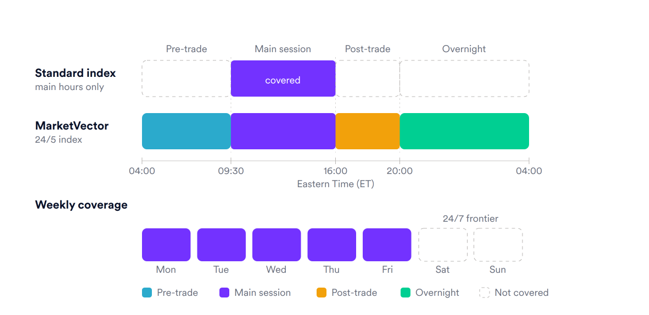
A standard index only covers the main session; the underlying feed is stitched together by Pyth (pre-trade, main session, post-trade and overnight via Blue Ocean ATS) into continuous weekday coverage, and MarketVector calculates and governs the index on top of it, with the weekend as the remaining 24/7 frontier.
1.1 The incumbent is a futures contract, not a token
If you want US equity exposure at three in the morning today, you do not buy a tokenized share. You buy NQ or ES. Index futures have carried overnight equity risk transfer for three decades. They are deep, centrally cleared, well governed and continuously marginable through nearly the entire week. Any argument for continuous cash-referenced indexes has to begin by conceding that, and this paper does.
Their limitation is not quality. It is coverage, and it takes two forms.
Coverage of exposure. Liquid index futures exist on broad beta. They do not exist on thematics like defense primes, on US-listed China ADRs, or on the broader innovation complex. A participant who wants one of those exposures overnight has exactly one option: take the most correlated liquid contract available and carry the difference. Section 5 measures that difference on our own live indexes, and it is far larger than most desks assume.
Coverage of purpose. A futures contract prices a contract, not a basket. Its level embeds financing, dividend expectations and roll dynamics, and it moves on those inputs independently of the securities underneath it. For a hedger this basis is a feature to be managed. For a calculation agent publishing an intraday NAV, for a NAV-referenced swap reset, or as the reference input a venue feeds into its mark-price framework, it is a defect. Those applications need a level of the cash basket. A future cannot supply one at any level of correlation. To be precise about scope: what an index administrator supplies is a governed reference index. The venue retains its own mark-price construction, clamping, funding formula, margin and liquidation rules, and remains responsible for them. The reference index is an input to that framework, not a replacement for it.
Nor are futures quite as continuous as the shorthand suggests. Globex halts for an hour every day and closes from Friday evening to Sunday evening. The honest framing of this market is therefore not governed feed against tokenized proxy. It is three instruments with three different failure modes, and the right choice depends on what the number is for.
Table 2: Three ways to price a closed equity market
|
Index futures |
Tokenized proxies |
Governed continuous index |
Continuity |
Near-continuous, deep, but halts daily and all weekend |
Always prints a number |
Sun 20:00 to Fri 20:00 ET, extensible to 24/7 |
Governance |
Exchange-governed, mature |
Venue or oracle model, varies |
Benchmark administrator, published methodology |
Tracks the cash basket |
No: embeds financing, dividends, roll |
Loosely, and least of all overnight |
Yes, by construction |
Thematic coverage |
Primarily broad and sector beta |
Primarily single names and selected ETFs |
Any defined basket |
Usable for iNAV or NAV reset |
Not a direct cash-basket level |
Not a direct cash-basket level |
Yes |
Suitable as a reference-index input |
Only where a contract exists |
Fragile |
Yes, as an input |
Source: MarketVector. Qualitative comparison; Section 5 quantifies the first and third rows on live index data.
1.2 The harder case: single names
The market has split two ways. One route derives the reference from perpetual futures on the individual stock. The other sources institutional price inputs directly and constructs a fair value from them. Both are workarounds for the same licensing problem. They are not equivalent, and the difference is not cosmetic.
A perpetual price is a derivative price.
It embeds funding and carry, and it reflects the state of one venue’s order book, including temporary imbalances that have nothing to do with the underlying security. Those distortions are usually small and occasionally are not, and nothing in the construction controls which. The closest familiar analogy is valuing an ordinary share from its ADR: often very close, sometimes not, and the gap is not something the calculating party can manage. For a security without a listed cash market at all, a pre-IPO name for instance, that trade-off is reasonable because there is no alternative. For a listed equity with a deep primary market that happens to be closed for the night, it is a poor substitute for the thing itself.
The Pyth 24/7 equity reference is not a pure perpetual price. It aggregates several price inputs and applies a fair-value methodology designed to remove derivative-specific distortions such as funding, carry and short-term order-book imbalance, so that the published level is intended to represent the underlying equity’s fair value while the primary cash market is closed. It is a workaround for the same licensing constraint, but it is a workaround that targets the cash price rather than accepting a derivative price in its place.
Where the distinction becomes contractual
For an indicative intraday level, the choice between these approaches is a question of quality. For an official closing value it becomes a question of contract. A closing level settles products, strikes NAVs and determines payments, and the party publishing it has to be able to explain what the number is and defend how it was produced.
The MarketVector baskets described in this paper are struck from exchange closing prices, which is the correct treatment where licensing permits it. Single-stock indexes are a different matter, and as they come to market the closing value will be calculated from Pyth’s reference.
2. Continuous Availability Isn't the Same as Benchmark Integrity
Continuous availability is not the same as benchmark integrity, and neither is institutional pedigree. The two real alternatives to a governed index fail in opposite directions. Index futures are high-quality prices for the wrong object: they price a contract, not the basket. Tokenized proxies are low-quality prices for the right object: they track the security, but loosely, and worst when it matters. This section tests the second claim on live data. Section 5 tests the first. Tokenized versions of major US stocks already trade 24/7 today. The relevant question for a derivatives venue, however, is not whether a price is continuously available, but how closely that price remains tethered to the underlying security when new information enters the market. Start with the unremarkable case. Over an ordinary trading week for AAPL, no earnings, no news, the two tokenized proxies we tracked, Ondo and xStocks1, never once went stale, but they never traded free either. Both ran a persistent, session-shifting premium to the Pyth reference, wider and choppier overnight than during the main session. That gap is the baseline cost of non-benchmark, always-on pricing, before anything actually happens.
1 Both are total return trackers, with an implied multiplier vs. spot.
Figure 3: One week in the sample, AAPL.
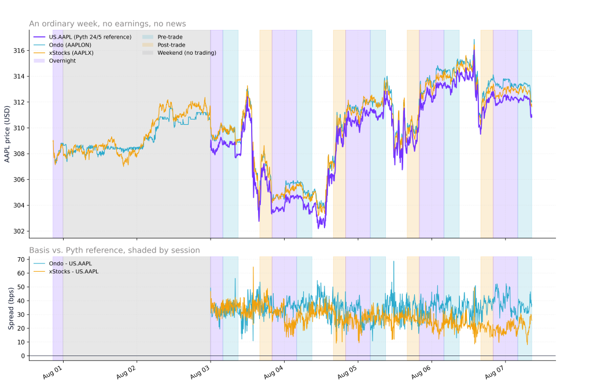
One week in the sample, AAPL. Both Ondo and xStocks carry a persistent 20-40bp premium to the Pyth reference that widens and gets noisier specifically in the overnight session. The weekend itself is shaded flat grey: no Blue Ocean session runs, so there is no real reference price to compare against, only the tokenized feeds trade through it.
Widening the lens from a single week to the full sample shows how closely each proxy actually tracks the Pyth reference, hour by hour. Across four weeks, correlation of five-minute returns runs at 0.93 for xStocks and 0.81 for Ondo through the regular session, then falls to 0.71 and 0.64 respectively once the cash market goes dark. The two proxies are not equivalent: xStocks tracks more closely at every hour of the day, and the gap between them is widest in the pre-market. Both are tightest between 16:00 and 17:00 ET, above 0.96, the hour immediately following the 16:00 closing auction, when the closing print anchors the reference and post-market arbitrage remains active. That is the mechanism working as it should, and it is precisely the mechanism that weakens overnight.
The weakest week is worth isolating rather than averaging away. In the week of 3 to 7 August, hourly correlation for Ondo fell as low as 0.23 and for xStocks to 0.28 in the dead of the overnight session, roughly half the four-week average. That week is the tail of our sample, not its center, and we report it as such. But it is the relevant tale for anyone setting margin: a reference price has to hold up in the worst week of the month, not the median one, because that is the week the liquidation engine is tested. Thin overnight liquidity does not just cost basis points. On its worst nights it loosens the connection to the underlying stock almost entirely.
Figure 4: . Correlation with the Pyth 24/5 reference by hour of day (ET), AAPL, 21 July to 18 August 2026
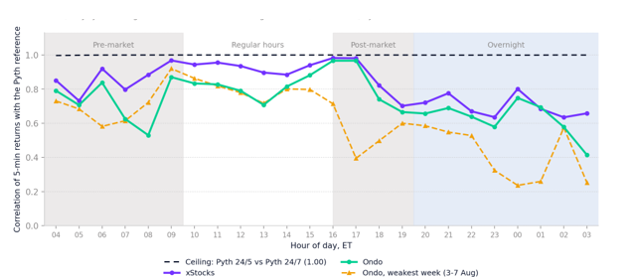
Pyth’s own 24/5 feed against its 24/7 feed, which agrees at 1.00 in every hour. Both feeds share one aggregation engine, so this is a dissemination-consistency reference rather than an independent check on pricing accuracy. Both proxies track the reference closely through the trading day and decouple through the overnight session. The amber series is Ondo in the weakest week of the sample.
None of this makes the Pyth/BOATS reference itself flawless, and it's worth being direct about that. There is no clean “better” answer here, it's a liquidity-versus-fidelity tradeoff. Pyth/BOATS is the more directly verifiable reference because it's an actual regulated venue trading the real share, but it is honestly thin overnight: real stretches of zero-change prints, and its own single-bar jumps of up to 22bps once a genuine trade finally lands. In the AAPL week shown, neither tokenized feed recorded a stale interval, and both always hand you a quote; but overnight that quote decouples from the real security more than at any other time of day, increasingly a function of the token's own crypto-venue supply and demand, or its oracle model, rather than genuine AAPL price discovery. The case for the governed feed is not that it is perfect. It is that its imperfections are visible, explainable and bounded by an actual trade, while the tokenized feeds' overnight behavior is neither visible nor bounded by anything happening in the underlying stock.
Now look at what happens when something does happen. We tested Microsoft's July 29, 2026 earnings release, a genuine after-hours gap, not a simulation. MSFT moved 4.80% in the minutes after the print. We compared four live feeds through that window: Pyth's institutionally sourced 24/5 feed (the same architecture underlying the MarketVector baskets), Pyth's companion 24/7 single-name feed, and the same two tokenized proxies, Ondo and xStocks, from Figure 3.
Figure 5: All four feeds around the July 29 earnings print.
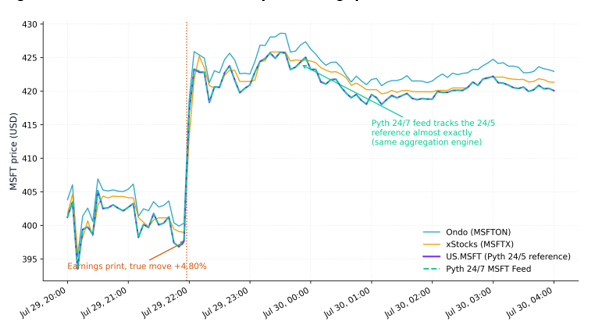
All four feeds around the July 29 earnings print. Pyth's 24/5 feed and its 24/7 counterpart (green, dashed) track each other almost exactly: same aggregation engine, different dissemination window.
The Pyth-sourced feeds moved together, as expected, since both are built from the same aggregation engine. Ondo and xStocks told a different story. Ondo overshot the observed underlying-market move by nearly half a point at the moment of print; xStocks undershot it by almost a full point. More telling, across an eight-hour window bracketing the print (4pm to midnight ET), xStocks simply stopped updating for stretches at a time, with 8.3% of its five-minute prints recorded as zero-change observations, while both Pyth-sourced feeds never once went stale across that same window. In the two hours immediately around the print itself, the gap between xStocks and the Pyth reference widened to more than 90 basis points at the peak.
Figure 6: Proxy performance at the earnings print
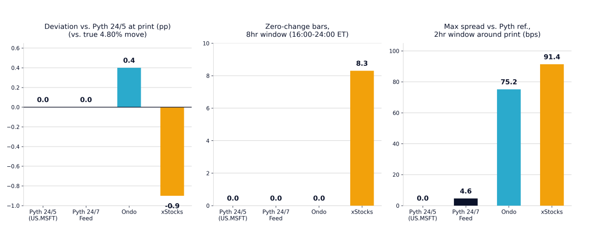
Figure 6. Quantified: deviation from the Pyth 24/5 reference at the moment of print, zero-change observations across an eight-hour window bracketing the print, and maximum spread versus the Pyth reference in the two hours around the print. Pyth's own 24/7 feed stayed within 5bps throughout.
For a perp venue, this is the relevant stress case: a large underlying repricing while cash-market liquidity is fragmented and client positions remain continuously marginable. The mark price cannot go quiet at exactly the moment it matters most.
None of this makes Ondo or xStocks illegitimate. They are simply optimized for always-on availability, not for institutional-grade fidelity to the underlying security at the moments that matter most. For a derivative whose margining, liquidation and settlement depend on the mark price, that difference is the entire risk model. This is precisely why MarketVector's role in the Coinbase partnership is not just adding Pyth data. It is index methodology, corporate-action treatment, market-disruption rules and fallback procedures wrapped around that data, to institutional benchmark standard.
3. Built to Institutional Standard, Proven in Production
This is not a laboratory prototype. It is exchange-ready infrastructure already proven in production: five MarketVector equity indexes are live today, three thematic baskets and two broad continuous benchmarks, all underlying real perpetual-style equity index futures on Coinbase, a regulated US exchange and the first venue to deploy this structure, not the last.
Table 3: The Five Live Indexes
Index |
Ticker |
Launch date |
Top holding |
Back-tested since base date* |
|---|---|---|---|---|
US Listed AI 10 |
08 Jun 2026 |
NVIDIA (27.79%) |
+201.17% |
|
US Listed China 10 |
08 Jun 2026 |
Alibaba (16.05%) |
-53.51% |
|
US Listed Defense 10 |
08 Jun 2026 |
Palantir (23.7%) |
+148.9% |
|
US Listed Innovators 100 |
08 Jun 2026 |
NVIDIA (14.5%) |
+129.3% |
|
Top 500 US Continuous |
07 Aug 2026 |
NVIDIA (8.4%) |
+302.1% |
*Top holdings and weights as of 10 August 2026, based on the most recent review and rebalance. Calculated (back-tested) price-return performance from the 31 Dec 2020 base date to 10 August 2026. Live calculation begins at each index’s launch date shown in the first column; figures before that date are back-tested history produced under the published methodology, not live performance.
Each index is administered to the same standard MarketVector applies across its $170bn+ of benchmarked assets: real-time dissemination, quarterly reviews, published index guides, corporate-action treatment, and governance aligned with IOSCO's Principles for Financial Benchmarks. That is the layer a raw data feed cannot provide on its own, and it's the layer a venue actually needs before it can put client margin against the number.
MVIN100's own Index Guide is explicit about what that governance means in practice: the index is calculated continuously from Sunday 20:00 ET to Friday 20:00 ET, with values disseminated to data vendors every second, built directly on Pyth Network Price Feeds. Nasdaq listing and availability in Pyth's price feeds are both hard eligibility requirements for any constituent, before methodology, weighting or anything else is even considered.
3.1 What an index administrator actually removes
An index level is useful to a venue for one reason: every move in it should correspond to a move in the value of the basket it represents, and nothing else. A number that holds to that can be margined against. A number that does not is one that occasionally moves for reasons its users cannot see, which is the property that makes a mark price dangerous.
Most of an administrator’s work is the removal of movement that fails that test. Capital events change quoted prices without changing what a holder owns. Scheduled reviews and rebalances change the constituents, so the sum calculated on Tuesday is a sum over a different set of companies than Monday’s. Securities are halted, suspended, delisted or renamed. Prices arrive in several currencies and have to be converted at a defined rate struck at a defined time. Publishers drop out and inputs go missing. Dividends are announced as estimates and confirmed later at a different amount, which means a level already disseminated was struck on a figure that turned out to be wrong. Left alone, each of these puts a step in the index that no investor in the underlying basket experienced.
The remedies differ by event, but what they share matters more than what separates them. Each is a rule that exists in writing before the event rather than a decision taken on the day, applies the same way every time it occurs, and can be shown to a counterparty afterwards. That is most of the distance between an index and a calculation, and it is the layer a raw feed cannot supply however good the prices are.
Corporate actions are the largest of these categories and the easiest to see, so they are worth following through in full.
3.2 What a corporate action does to an index
Companies regularly do things that change the price of their shares without changing what a shareholder owns. A four-for-one split turns every share into four worth a quarter as much. A dividend hands cash to the holder, so the share is worth less on the morning it goes ex. A merger can make one company’s shares disappear and reappear as shares in another. The price on the screen moves, sometimes sharply. The investor is no better or worse off than the day before.
An index is a weighted sum of those prices, so it inherits every one of those moves unless somebody corrects for them. This failure is quieter than the ones in Section 2. A stale feed stops telling you anything, which at least shows. An index that passes a split straight through keeps publishing, still looks orderly, and is simply wrong by several percent that nobody lost.
Making the correction is routine. What is not routine is when it has to be made. A conventional index closes at the end of the day and the administrator sends the corrections out overnight, ready for the next morning. The market is shut while that happens, so the fix lands in a gap where nothing is being priced. Our indexes run from Sunday at 20:00 ET to Friday at 20:00 ET and have no gap. Every correction has to be live before the overnight session opens, which is the evening before rather than the following morning.
This is work no price feed performs, and no venue inherits it by licensing one. A feed reports what a security traded at. Deciding that the price reflects a capital event rather than a loss, and fixing the index before the next print, is the administrator’s job.
3.3 Three events, three mechanisms
Three corporate actions processed on these indexes over the summer show how that works in practice. The easiest way to follow them is to ask, in each case, what actually happened to somebody who held the stock overnight.
Table 4: Three corporate actions processed on the continuous indexes
Event |
Index |
Effective |
How the level is protected |
|---|---|---|---|
CrowdStrike four-for-one stock split |
MVIN100 |
2 Jul 2026 |
The share count is multiplied by four as the price divides by four. The two offset exactly, the constituent’s market capitalisation is unchanged, and the divisor does not need to move. |
General Dynamics cash dividend of 1.59 USD gross |
MVUDF10N |
2 Jul 2026 |
The price falls because cash has genuinely left the company. The divisor is reduced instead, which reinvests the dividend across the basket so the level continues uninterrupted. |
AvalonBay absorbed by Equity Residential at 2.793 shares per share |
MVPUSC |
18 Aug 2026 |
The target leaves the index and the acquirer’s shares, free float and cap factor are rebuilt so the surviving constituent carries exactly the combined exposure of the two. No divisor change is required. |
Events processed under the published methodology. Parameters: CrowdStrike shares 254,580,533 to 1,018,322,132, divisor unchanged; General Dynamics divisor 410,598,415.11 to 410,523,306.26 on a net dividend of 1.113 after a 30% withholding rate; Equity Residential shares 374,671,735 to 763,211,744, free float factor 0.53 to 0.61, weighting cap factor 0.95230909, divisor unchanged. Source: MarketVector corporate action forecast files and index closing and opening files.
CrowdStrike split four for one on 2 July. Somebody who held 100 shares at the close owned 400 the next morning, and each was worth a quarter as much: 772.74 became 193.185. Their money did not change at all. The screen, however, showed the price down by three quarters.
MVIN100 handles this by counting the extra shares at the same moment the price falls. The company is worth what it was worth the day before, 167.2 billion USD on both sides of the event, so the index simply carries on. Had we passed the new price through against the old share count, the index would have opened 16 points lower, at 3,845.88 instead of 3,862.21. That is a fall of 0.42%, and not one holder of the basket would have lost a cent of it.
General Dynamics paid a dividend on 2 July, and this one is genuinely different. The price fell because cash really did leave the company and go to shareholders. Somebody holding the stock had slightly less stock and some cash in hand, so the fall on the screen was real.
The defense index here is a total return index, which means it assumes that cash is put straight back to work in the basket. That is what carries the level across the event at 2,765.084. Skip the step and the index looks as though it gave up half a point of performance, when shareholders had just received exactly that amount in cash.
AvalonBay disappeared on 18 August, bought by Equity Residential. Anyone holding AvalonBay received 2.793 Equity Residential shares for each share they owned. Nothing was lost. The exposure moved from one company into another, and the combined business carried on trading under a new name.
An index cannot leave a hole where a constituent used to be. AvalonBay comes out and the buyer is enlarged to carry both businesses, and the arithmetic ties out to the cent: 15.58 billion plus 12.64 billion on 17 August, 28.22 billion the next morning. Had we simply deleted AvalonBay and left the buyer as it was, MVPUSC would have dropped, as though the money had evaporated on a deal where nobody lost anything.
That last one carried two extra problems that only arise when the index never closes. AvalonBay’s shares stopped trading on 17 August, so for its final session there was no market to take a price from, and the methodology valued it from the terms of the deal instead. On the same date the buyer changed its name to Vivmark Residential and its ticker from EQR to VMRK. Anyone using the index has to have both of those in hand before their systems next look up the old symbol. When the market reopens at eight in the evening rather than half past nine in the morning, that means the night before.
Three events, three different fixes, and the same result each time. The published level went through the event as though nothing had happened, because the work was done before the event rather than after it. Each of these corrections travelled in a file named for the next business day. For an index that starts calculating at the opening bell, sending it overnight is soon enough. For one that starts calculating the previous evening, it is not.
3.4 What the methodology falls back to
Continuous calculation does not remove the official trading session, and the methodology relies on it. The underlying market still has defined pre-trade, main and post-trade windows, and those are the reference points the index falls back to when the continuous feed is degraded or unavailable. A governed index therefore always has a last price struck in an official session to fall back on, together with published rules for when that fallback applies and how long it holds. Continuity on its own provides neither.
That governance is also what defines the session boundary itself. Because the calculation window is a published rule rather than a byproduct of whichever venues happen to be quoting, the index has a defined open and a defined close that a venue can build funding and margin schedules around. Section 4 looks at what happens at that boundary.
Extending our thematic equity expertise into 24/5 infrastructure is not simply a technical upgrade — it is thinking of what 'round-the-clock’ price discovery looks like.
- Josh Kaplan, Head of Research & Investment Strategy, MarketVector Indexes
Pyth brings the other half: price aggregation sourced directly from more than 125 institutions, exchanges, trading firms and market makers, publishing first-party, not intermediated through a single venue's order book. Pyth was also the first provider of 24/5 US equity pricing at scale, through its exclusive collaboration with Blue Ocean ATS, which is the same overnight session underlying the feeds tested in Section 2. This combination of governed methodology plus direct-publisher data is what makes the resulting index licensable as a genuine benchmark, not just a data product.
4. 24/5 is the Beachhead, 24/7 the Destination
The five Coinbase baskets run 24/5 today because that's what the underlying Blue Ocean overnight session supports: genuine weekday-night liquidity, but still dark from Friday evening to Sunday evening US time. In the data, that boundary is exact. The governed session closes Friday at 20:00 ET and reopens Sunday at 20:00 ET; in the five-minute sample, the final pre-close observation is timestamped 19:55 ET. Pyth is already a step ahead of that boundary: its standalone 24/7 single-name feeds (including the MSFT feed used in Section 2) run straight through the weekend, and the joint MarketVector framework is explicitly built to extend from 24/5 to 24/7 as reliable weekend-grade pricing sources mature.
We can show what that frontier looks like today. Over the August 1-2 weekend, Pyth's 24/7 MSFT feed kept publishing a continuous, orderly price. The 24/5 feed underlying today's Coinbase baskets went dark, exactly on schedule. And xStocks, the only “always-on” proxy without an institutional feed behind it, spent long stretches flat, printing the identical price for 20-30 minutes at a time, punctuated by sudden multi-point moves in a single five-minute bar before snapping back.
Figure 7: The weekend frontier
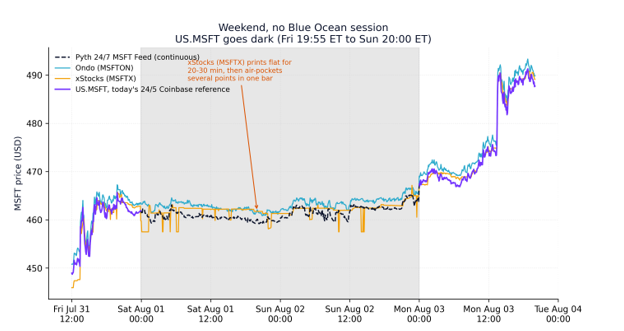
The weekend frontier. In the five-minute sample, the 24/5 reference’s final pre-close observation is Friday 19:55 ET, consistent with the governed 20:00 ET close; dissemination resumes Sunday at 20:00 ET. Pyth’s 24/7 feed stays continuous and orderly through the weekend; xStocks goes stale for long stretches, then air-pockets. With no cash market open there is no observable ground truth over the weekend, so this compares continuity and print behavior, not accuracy.
The same boundary shows in our own indexes. Both weekends in the August sample close and reopen exactly on that published schedule. The boundary is a methodology rule rather than an artifact of whichever venues happen to be quoting. It is the governed session definition doing precisely what the methodology says it does, which is the behavior a venue needs to be able to rely on when it sets funding and margin schedules around it.
That pattern, long stale stretches punctuated by sharp, thinly-traded jumps, is exactly the fragility a perpetual contract cannot tolerate in its mark price. It creates additional manipulation and forced-liquidation risk that an independent, multi-source reference price exists to prevent. It is also the clearest illustration of why “always prints a number” and “always prints a trustworthy number” are different products, and why the roadmap from 24/5 to genuine 24/7 has to be built on governed infrastructure rather than bolted on top of thin liquidity.
5. The Basis Nobody Hedges Well
Every desk that carries international or thematic equity exposure overnight follows the same procedure. Identify the most closely correlated liquid futures contract available. Hedge with it. Carry the difference.
The procedure is correct. The constraint is that “most correlated available” and “correlated enough” are different standards, and the distance between them turns out to be far wider than most desks assume. We measured it on our own live indexes across the twelve overnight sessions from 2 to 18 August 2026, hedging each against the front-month E-mini S&P 500 contract, the deepest single instrument available across the whole overnight window. NQ is reported as a robustness check in the appendix and, for the broad innovation basket, tracks somewhat more closely.
5.1 What the best available hedge leaves behind
Table 4: Overnight hedge performance of the deepest common US futures hedge tested
Exposure |
Hedge |
Correlation (90% CI) |
R² |
Unhedged |
Hedge ratio |
|---|---|---|---|---|---|
MVIN100, broad innovation |
ES |
0.805 (0.774 to 0.833) |
0.65 |
35% |
1.68 |
MVUAI10, US-listed AI |
ES |
0.791 (0.759 to 0.817) |
0.63 |
37% |
2.05 |
MVUDF10, US-listed defense |
ES |
0.459 (0.401 to 0.521) |
0.21 |
79% |
0.93 |
MVUCH10, US-listed China |
ES |
0.079 (0.027 to 0.131) |
0.01 |
99% |
0.33 |
MVUCH10, hedged on HSI instead |
HSI |
0.686 (0.634 to 0.731) |
0.47 |
53% |
0.81 |
Overnight session, 20:00 to 04:00 ET, twelve sessions, 2 to 18 August 2026. Correlations from five-minute log returns, zero-change bars excluded on both legs. Intervals from a 5,000-draw bootstrap resampling whole sessions rather than bars, because bars within a session share a common factor. Hedge ratios are estimated at 30-minute frequency for the reason given in 5.3. Source: MarketVector.
Read the last two columns together. A front-month S&P future explains roughly two thirds of the overnight variance of broad innovation exposure. It explains a fifth of defense. It explains one percent of US-listed China.
That last figure is not a marginal degradation. For the China basket, one of the world’s most liquid equity index futures, applied to a portfolio of US-listed securities, delivers economically negligible hedge effectiveness in this sample. A desk running that position overnight is carrying essentially unhedged risk while believing it is hedged.
Figure 8: Share of overnight variance left unhedged by the deepest common US futures hedge tested
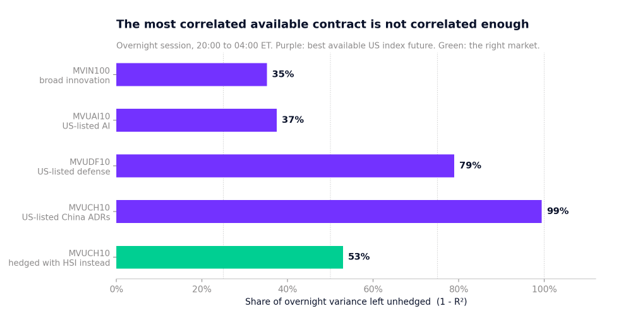
Share of overnight variance left unhedged by the deepest common US futures hedge tested. The final bar shows the same China basket hedged in the market that is actually open during the window, which is the only case here where a matched instrument exists.
5.2 Why the China result is the one that matters most
Because it has a control. Hong Kong trades from 21:30 to 04:00 ET, so for almost the whole US overnight window the relevant market is open. Hedging the same basket on the Hang Seng instead of the S&P moves explained variance from one percent to forty-seven.
That comparison isolates the variable. The problem is not that overnight pricing is noisy, and not that the basket is inherently unhedgeable. The problem is instrument coverage. Where a reference instrument exists in the right market, participants use it and it works. Where none exists, the risk simply sits there. For AI, defense primes and the innovation complex there is no equivalent of the Hang Seng. That absence is the gap, and the China case is the evidence that closing it raises explained variance from 1% to 47%.
5.3 Two findings a desk can act on immediately
The ordering never reverses. Twelve sessions is a short sample and we will not pretend otherwise. What makes the result usable is that the ranking holds in every single session. In all twelve, broad innovation is hedged better than defense, defense better than China, and the China basket better on the Hang Seng than on the S&P. Every pairwise comparison is twelve for twelve, a one-sided sign test at p = 0.0002 per comparison, and the intervals for the three economically distinct tiers, broad exposure, defense and China, do not overlap. An ordering that never flips does not need a long sample. Magnitudes do, which is why the table reports intervals.
Hedge ratios are attenuated at high frequency. Correlations are stable across five, fifteen and thirty-minute sampling. Hedge ratios are not. The MVIN100 ratio against ES rises from 1.44 at five minutes to 1.68 at thirty; defense rises from 0.67 to 0.93. This pattern is consistent with non-synchronous overnight pricing attenuating the estimate rather than with a genuine change in exposure. The consequence is practical: in this sample, hedge ratios estimated from five-minute data would have produced hedge sizes roughly fifteen to twenty-five percent smaller than those estimated at thirty minutes. The results support using thirty-minute or longer intervals for this type of overnight estimation.
Figure 9: Overnight correlation with the future hedge tested, session by session.
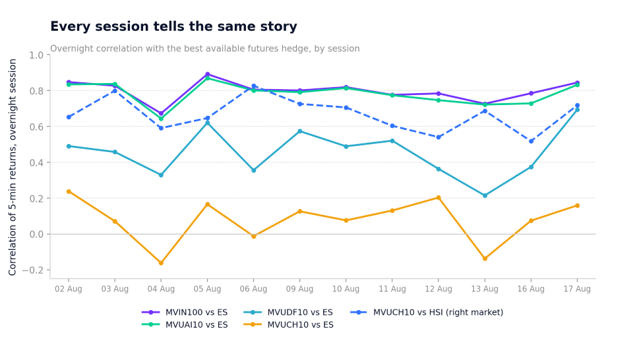
Overnight correlation with the futures hedge tested, session by session. The economically relevant ordering, broad exposure against defense against China, does not reverse in any session. The dashed series is the same China basket measured against the market that is open during the window.
One limitation stated plainly. These twelve sessions fall inside a single quiet fortnight. The bootstrap resamples within that period, so narrow intervals establish that the ordering is stable in this regime, not that the magnitudes generalize. The window contains no China policy shock; no consequential inflation print and no geopolitical event. We would rather publish an ordering that is decisive in one regime than a magnitude that looks precise and is not.
5.4 What this means for these indexes
The pattern across the baskets is not a list of results, it is a rule. Liquid index futures price broad beta well. The further an exposure sits from broad beta, the less of it any existing contract explains, until at the far end hedge effectiveness becomes economically negligible. That is not a defect of the overnight session. It is a gap in the instrument set.
The argument for these indexes follows in a specific order. A venue seeking an independently governed benchmark for defense primes or US-listed China exposure has no continuously calculated candidate to list against today. The benchmark is not a refinement that arrives once the market matures. It is the precondition for the market existing at all. The MarketVector baskets are the first instance of that sequence completing, and the Coinbase listings are what it looks like when it does.
5.5. Why this holds even where the correlation is high
Two of the baskets track the front-month S&P closely overnight, and a reader might reasonably ask why a continuous benchmark is needed where a future already moves in step. The answer is that correlation and adequacy are different tests, set at very different levels.
A hedger with an eighty percent correlation retains the residual knowingly and sizes for it. A reference price has no such luxury, because the mark price is not an approximation of the number, it is the number. Marked against a fitted futures proxy, even our most closely tracking basket drifts by roughly twenty basis points inside a typical overnight session. On a position carrying ten times leverage that is a two percent error in unrealized profit and loss, applied to a book where liquidations are triggered mechanically. And because that hedge ratio was fitted on the same data it was measured against, the figure is a lower bound.
Beneath that sits a difference no correlation can close, set out in Section 1.1: a futures contract prices a contract. For an intraday NAV, a NAV-referenced swap reset, or a mark price that closes client positions, only a level of the cash basket will do, and only a continuously calculated index produces one.
So, these indexes answer two distinct needs rather than one. For defense and China they supply exposure the market cannot otherwise reach. For the broader baskets they supply the right kind of number for exposure the market can already approximate. A venue building equity perpetuals needs both and needs them governed. Futures tell you where the market is going. Only an index tells you where the basket is.
6. How it Works and How a Venue Plugs In
Figure 10: The architecture behind every basket, shown for the four thematic baskets
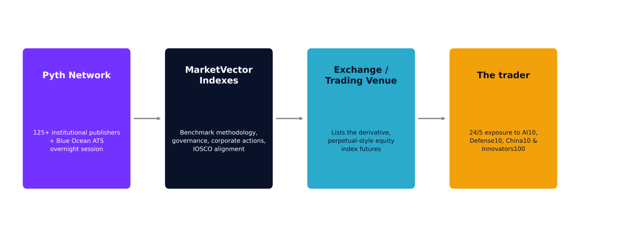
The architecture behind every basket, shown for the four thematic baskets; the Top 500 US continuous benchmark is produced on the same architecture. Pyth sources and aggregates, MarketVector governs and calculates, the venue lists the derivative, the trader gets continuous exposure. Coinbase is the first production deployment of this architecture, not a fixed endpoint.
The division of labor is deliberately narrow. Pyth owns data sourcing and aggregation: the publisher network, the Blue Ocean overnight collaboration, and the infrastructure to keep calculating through hours no single exchange covers. MarketVector owns everything a benchmark administrator owns: index construction methodology, component selection and weighting, corporate-action treatment, market-disruption and fallback rules, and ongoing governance. The venue lists a derivative against a number it did not have to build or defend itself.
For a prospective exchange or trading venue, the practical questions are usually about speed and customization, not concept. On both counts, the framework was built for licensing beyond a single client, and it flexes to the scope of what's needed. A single-name or single-asset feed can be scoped and licensed quickly on the existing Pyth-MarketVector architecture; multi-asset thematic baskets, the more complex case and the one this paper focuses on, go through the full joint framework already proven with the five Coinbase baskets. Turnaround on a custom index build is measured in days to weeks, not quarters, and every index ships with a published methodology and identifiers (ISIN, Bloomberg, Reuters, FIGI) from day one.
If your platform lists, or wants to list, perpetual or continuous-settlement products referencing equities, commodities or thematic baskets, the reference-price problem in Section 1 already applies to you, whether or not it has caused a visible incident yet. The Coinbase deployment is a production reference deployment; it was never meant to be exclusive. MarketVector and Pyth can scope a custom basket, single-name feed, or bespoke methodology build around your specific product and listing venue.
7. From Idea to Listed Perpetual
None of this requires reproducing what took Pyth and MarketVector years to build. For a new venue, the path from a defined exposure to a listed, continuously priced derivative runs through six steps, and it is a process, not a research project.
Figure 11: From idea to listed perpetual
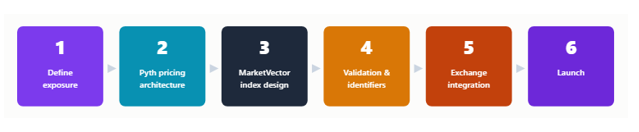
From idea to listed perpetual: the same six-step process already used to bring the five Coinbase baskets to market.
Table 5: The Six Steps
Step |
What happens |
|---|---|
1. Define exposure |
The venue specifies what its clients want continuous exposure to: a single name, a thematic basket, or a custom benchmark. |
2. Pyth pricing architecture |
Direct-publisher pricing is scoped across the sessions the product needs, including the Blue Ocean ATS overnight collaboration for US equities. |
3. MarketVector index design |
Eligibility screens, weighting scheme, corporate-action treatment, and market-disruption and fallback rules are built and documented. |
4. Validation & identifiers |
The methodology is back-tested and published; the index receives its identifiers (ISIN, Bloomberg, Reuters, FIGI) before anything goes live. |
5. Exchange integration |
Real-time index values are disseminated directly into the venue's market-data, reference-price and risk systems. |
6. Launch |
The derivative goes live against an independently governed, continuously-priced number. |
8. The Bottom Line
Perpetual markets built on equities need a reference price that keeps pace with them through every session the venue actually trades, not just the six and a half hours a standard index covers. That continuous, governed weekday price already exists, built and running in production rather than proposed, and it doesn't have to be rebuilt from scratch for every new venue. If your platform is evaluating equity or thematic perpetuals, the weekday infrastructure question has already been solved. The only open question is whether you build it or license it. Contact MarketVector Indexes to start that conversation.
Appendix: how we built the case studies in this paper
Sections 2 and 4 use real five-minute price data pulled directly from the feeds discussed, for both AAPL (the ordinary-week baseline and hourly correlation in Figures 3-4) and MSFT (the earnings-gap case study in Figures 5-6 and the weekend case study in Figure 7): Pyth's institutionally-sourced 24/5 US equity reference feed, Pyth's standalone 24/7 single-name feed for the same stock, and two independently operated tokenized-equity price feeds tracking the same underlying security (Ondo and xStocks). All series were aligned to a common timestamp grid. “Staleness” is defined as consecutive five-minute prints with zero price change; “spread” is the basis-point difference against the Pyth 24/5 reference at each timestamp.
Section 5. Index levels are MarketVector live dissemination, published every second and resampled to five-minute bars. The corrected series begins at Sunday 2 August 20:00 ET, exactly the overnight session open. Futures series are front-month ES and NQ, five-minute, sourced from Pyth so equity and futures legs share one clock and bar convention; Hang Seng front-month is from HKEX. ES carries the headline table because its window covers all twelve sessions. Results on NQ are materially identical, with MVIN100 at 0.877 and MVUCH10 at 0.098.
Research frontier: which way does causality run? Today index futures set the overnight tone and pre-market cash prints follow, except on earnings nights when security-specific news can only be expressed in the cash session. As overnight cash volume grows, the share of price discovery attributable to cash prints should rise, and at some level of liquidity the relationship inverts. That crossover is measurable with standard information-share methods and it is commercially significant, because it is the point at which a continuous cash-referenced index stops being a convenient input and becomes the reference the rest of the complex prices against. We intend to measure it. |
|---|
Sources and substantiation
Full calculation rules, constituents and weights are published in each index guide at marketvector.com, which prevails over any description here. MarketVector Indexes GmbH administers its benchmarks in line with the IOSCO Principles for Financial Benchmarks, applying the governance frameworks developed under the EU Benchmarks Regulation; its indexes qualify as non-significant benchmarks and fall outside that Regulation’s direct scope as of 1 January 2026. Primary sources: MarketVector Indexes, the 24/5 index launch announcement, Pyth Network and Blue Ocean Technologies. Third-party figures are as reported by those organisations. All analysis in Sections 2, 4 and 5 is reproducible from the series and windows listed above.
About the Author(s):
Martin Leinweber leads digital asset research and strategy at MarketVector Indexes, where he develops index products, publishes institutional research, and serves as the firm's primary voice on crypto markets to a global client base. His work sits at the intersection of systematic investing and an emerging asset class, translating rigorous quantitative frameworks into actionable insight for institutional investors. Before joining MarketVector, Martin spent nearly two decades as a Portfolio Manager across equities, fixed income, and alternative investments. At Quoniam Asset Management, one of Germany's foremost quantitative houses, he managed active funds for institutional clients including insurance companies, pension funds, and sovereign wealth funds. Earlier in his career at MEAG, the asset manager of Munich Re and ERGO, he contributed to the firm's international expansion, including the establishment of a joint venture with PICC, China's largest insurance company, with operations in Shanghai and Beijing. Martin is co-author of two Wiley publications: Asset-Allokation mit Kryptoassets: Das Handbuch (2021), the first institutional handbook on integrating digital assets into traditional portfolios, and Mastering Crypto Assets: Investing in Bitcoin, Ethereum, and Beyond (2024). He holds a Master of Economics from the University of Hohenheim and is a CFA Charterholder.
IMPORTANT DEFINITIONS AND DISCLOSURES
Copyright © 2026 by MarketVector Indexes GmbH (‘MarketVector’) All rights reserved. The MarketVector family of indexes (MarketVectorTM, Bluestar®, MVIS®) is protected through various intellectual property rights and unfair competition and misappropriation laws. MVIS® is a registered trademark of Van Eck Associates Corporation that has been licensed to MarketVector. MarketVectorTM and MarketVector IndexesTM are pending trademarks of Van Eck Associates Corporation. BlueStar®, BlueStar Indexes®, BIGI®, and BIGITech® are trademarks of MarketVector Indexes GmbH.
Redistribution, reproduction, and/or photocopying in whole or in part are prohibited without written permission. All information provided by MarketVector is impersonal and not tailored to the needs of any person, entity, or group of persons. MarketVector receives compensation in connection with licensing its indexes to third parties. You require a license from MarketVector to launch any product that is linked to a MarketVectorTM Index to use the index data for any business purpose and all use of the MarketVectorTM name or name of the MarketVectorTM Index. The past performance of an index is not a guarantee of future results.
It is not possible to invest directly in an index. Exposure to an asset class represented by an index is available through investable instruments based on that index. MarketVector does not sponsor, endorse, sell, promote, or manage any investment fund or other investment vehicle that is offered by third parties and that seeks to provide an investment return based on the performance of any index. MarketVector makes no assurance that investment products based on the index will accurately track index performance or provide positive investment returns. MarketVector is not an investment advisor, and it makes no representation regarding the advisability of investing in any such investment fund or other investment vehicle. A decision to invest in any such investment fund or other investment vehicle should not be made in reliance on any of the statements set forth in this document.
Investments into cryptocurrencies and/or digital assets are subject to material and high risk including the risk of total loss. The calculated prices may not be achieved by investors as the calculated price is based on prices from different trading platforms. Furthermore, an investment into cryptocurrencies and/or digital assets may become illiquid depending on the trading platform or investment product used for the specific investment. Investors should carefully review all risk factors disclosed by the relevant trading platform or in the product documents of relevant investment products.
Prospective investors are advised to make an investment in any such fund or other vehicle only after carefully considering the risks associated with investing in such funds, as detailed in an offering memorandum or similar document that is prepared by or on behalf of the issuer of the investment fund or other vehicle. The inclusion of a security within an index is not a recommendation by MarketVector to buy, sell, or hold such security, nor is it considered to be investment advice.
All information shown prior to the index launch date is simulated performance data created from backtesting ("Simulated past performance”). Simulated past performance is not actual but hypothetical performance based on the same or fundamentally the same methodology that was in effect when the index was launched. Simulated past performance may materially differ from the actual performance. Actual or simulated past performance is no guarantee for future results.
These materials have been prepared solely for informational purposes based upon information generally available to the public from sources believed to be reliable. No content contained in these materials (including index data, ratings, credit-related analyses and data, model, software, or other application or output therefrom) or any part thereof (Content) may be modified, reverse-engineered, reproduced or distributed in any form by any means, or stored in a database or retrieval system, without the prior written permission of MarketVector. The Content shall not be used for any unlawful or unauthorized purposes. MarketVector and its third-party data providers and licensors (collectively “MarketVector Parties”) do not guarantee the accuracy, completeness, timeliness, or availability of the Content. MarketVector Parties are not responsible for any errors or omissions, regardless of the cause, for the results obtained from the use of the Content. THE CONTENT IS PROVIDED ON AN “AS IS” BASIS. MARKETVECTOR PARTIES DISCLAIM ANY AND ALL EXPRESS OR IMPLIED WARRANTIES, INCLUDING, BUT NOT LIMITED TO, ANY WARRANTIES OF MERCHANTABILITY OR FITNESS FOR A PARTICULAR PURPOSE OR USE, FREEDOM FROM BUGS, SOFTWARE ERRORS, OR DEFECTS, THAT THE CONTENT’S FUNCTIONING WILL BE UNINTERRUPTED OR THAT THE CONTENT WILL OPERATE WITH ANY SOFTWARE OR HARDWARE CONFIGURATION. In no event shall MarketVector Parties be liable to any party for any direct, indirect, incidental, exemplary, compensatory, punitive, special, or consequential damages, costs, expenses, legal fees, or losses (including, without limitation, lost income or lost profits and opportunity costs) in connection with any use of the Content even if advised of the possibility of such damages.
Get the latest news & insights from MarketVector
Get the newsletterRelated:
Most popular
-
 Commentary
How Rising Rates Can Impact Equity Returns
-
 Commentary
The Space Economy Is Taking Off