
I have long argued that the 1970s are the best template for this decade. Gold is now about 26% below its January high, so I tested the idea against the data. To keep the comparison clean, I start the 1970s in the floating-price era, from the Nixon shock in August 1971, not the fixed-price years before it.
The short version is that the depth of this correction is textbook 1970s. The duration is where it gets uncomfortable.
Normal depth, uncomfortable duration
Gold peaked on 28 January 2026 at about $5,416. Its worst close since then was about $3,978 in July, a drawdown of 26.6%. It trades near $4,020 today.
The 1970s bull market was not a straight line. Before the final 1980 peak, gold suffered four drawdowns of 20% or more: -29% in 1973, -25% in 1974, -47% in 1974–76 and -22% in 1978. A 26% pullback fits that pattern.
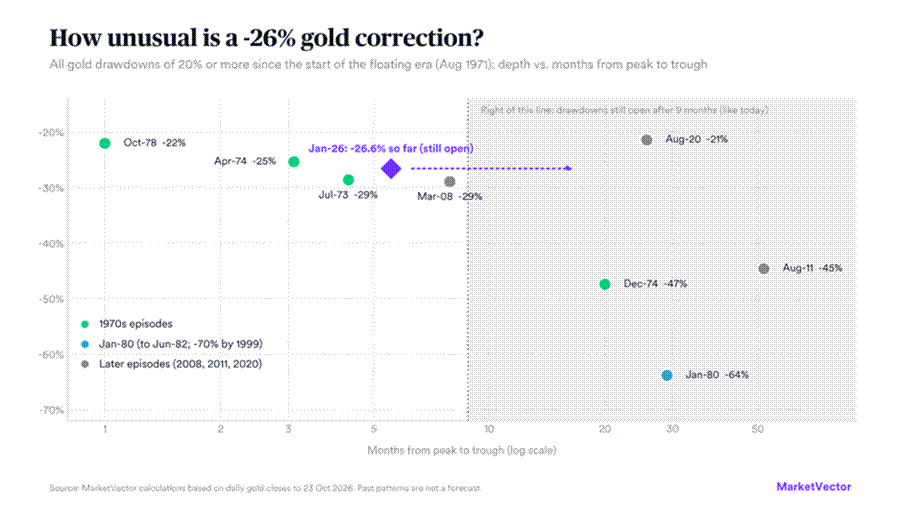
Look at the right side of that chart. Three of the four 1970s corrections were over within about seven months. This one is already nine months old. The only 1970s precedent that lasted this long is 1974–76, which bottomed 20 months after the peak at -47%.
The wider record is similar. Four earlier drawdowns were still open after nine months (1974, 1980, 2011 and 2020). All of them set their final low later, at months 20, 29, 52 and 26. Their troughs ended up 1.2 to 1.45 times as deep as the worst drawdown at month nine, with 2011–15 an outlier at 2.4 times.
Applied mechanically to today, that points to roughly -31% to -39%, or about $3,300 to $3,750. Four data points make this a rough prior, not a model.
The path rhymes with 1974, not 1980
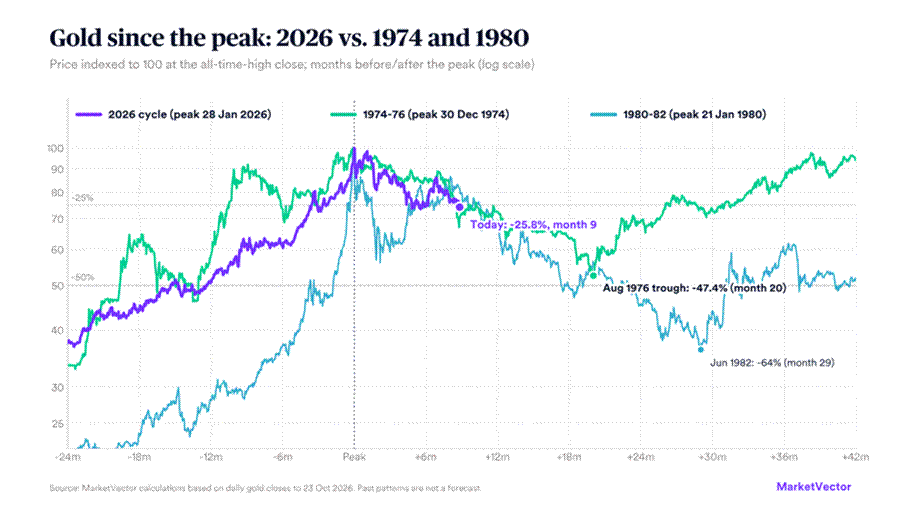
Aligned at their peaks, 2026 tracks 1974 closely. It fell faster early on: -15% after 90 days versus -10% in 1974. After about nine months both stood at roughly -26% to -30%.
Both were stair-steps lower, with failed rallies. In 1975–76 the biggest bounce before the final low was only 13%. This year’s 17% bounce into late August has been fully retraced, and gold is back within about 1% of its July low.
1980 looks nothing like this. That peak followed a 255% run in twelve months and then fell 38% in 90 days. The 2026 run-up was a still-parabolic 96%, and the unwind has been far more orderly.
Volatility is 70s-like too. Realized volatility this year is about 30%, against about 16% in 2023–25. Only five calendar years since 1972 were higher.
Two clocks, two readings
How the 1970s map onto today depends on how the two periods are aligned. Neither alignment is a forecast. Together they show how the same historical episode can be read in different ways.
• Peak clock: If the December 1974 peak is aligned with January 2026, the 1974–76 path would place the corresponding low around September 2027 and the subsequent high around 2029. A decline of the same proportion would correspond to a level near $2,850.
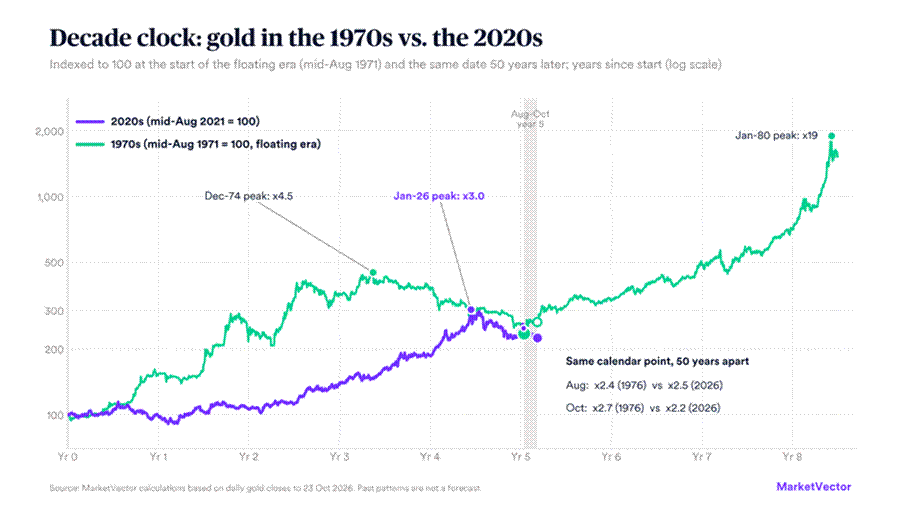
• Decade clock: If calendar dates are aligned, so that 1976 maps to 2026, the August 1976 low corresponds to this July’s low. On this alignment, the low would correspond to having already occurred, the current period would resemble a retest, and the subsequent high would fall around mid-2028.
The chart adds a sanity check. Indexed to the start of the floating era, the first 1970s leg ran further (x4.5 at the 1974 peak) than the 2020s leg (x3.0), yet the correction has been shallower so far. At the same calendar point in August, gold stood at x2.4 in 1976 and x2.5 in 2026. By October the gap has opened, at x2.7 versus x2.2. So the two decades are in the same ballpark, but 2026 is not tracking 1976 tightly.
I would not over-read the decade clock. The 2026 peak arrived about 13 months later in the cycle than the 1974 peak, so both clocks cannot be right.
Where the 1970s stop being a guide
Two things differ from 1975–76.
Official buyers. In the mid-1970s the US Treasury and the IMF were adding supply. Today central banks are the marginal buyer. China’s central bank bought gold for a 23rd straight month in September, adding 740,000 ounces, its largest purchase since 2023, even as prices fell.[1] At the same time, Western gold ETFs lost 45 tonnes in the second quarter while central banks bought 289 tonnes.[2] That argues against a full -47% replay. It is not a floor, though: central banks were also buying through 2011–13, and gold still lost 45%.
Debt. Debt held by the public was about 23% of GDP in 1974.[3] It reached 100.2% at the end of March 2026.[4] That strengthens the long-run case for gold. It is also part of today’s headwind, because heavy issuance helps push yields up. Debt is a reason to doubt the depth of 1974–76. It does not tell us when the turn comes.
A third difference deserves its own section, because it is the one most likely to mislead: gold stocks.
Gold stocks: where the analogy breaks
Gold miners are the obvious next question. For the 1970s I used the Fama-French “Gold” industry portfolio, and for today the total return version of the MarketVector™ Global Gold Miners Index (MVGDX). The two behave like different assets.
In the 1970s, gold stocks were a weak proxy for bullion. Between the December 1974 peak and the August 1976 low, gold fell 47%, while the value-weighted gold-stock portfolio fell 13% and the equal-weighted one rose 22%. On the way up, from August 1971 to December 1974, gold gained 349% against 31% (85% equal-weighted) for gold stocks. Their 63-day sensitivity to bullion was only 0.4 to 0.9.
Today’s miners are the opposite. Their sensitivity to gold runs at 1.5 to 2.2, and in each of the last three gold drawdowns they fell roughly 1.7 to 2.5 times as much as bullion. From September 2022 to January 2026 they rose 344% against 134% for gold.
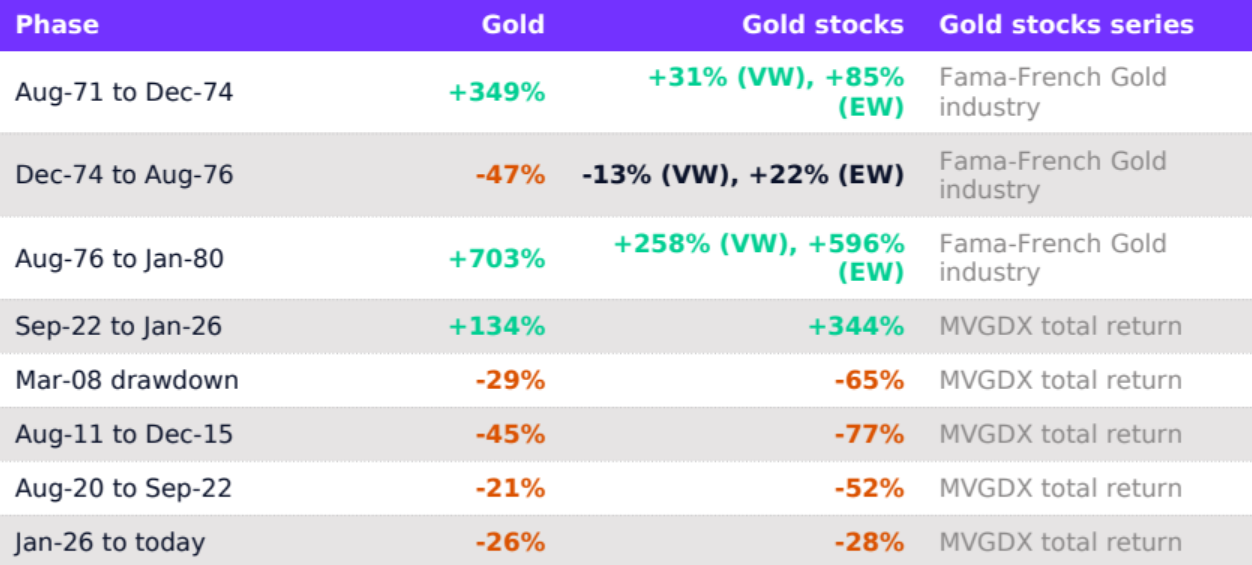
That matters for how you read the analogy. The 1970s describe the path of bullion, not of the miners. Reading “gold stocks fell only 13% in 1975–76” as comfort for today would mean relying on an asset that no longer exists. Modern miners are a levered bullion bet.
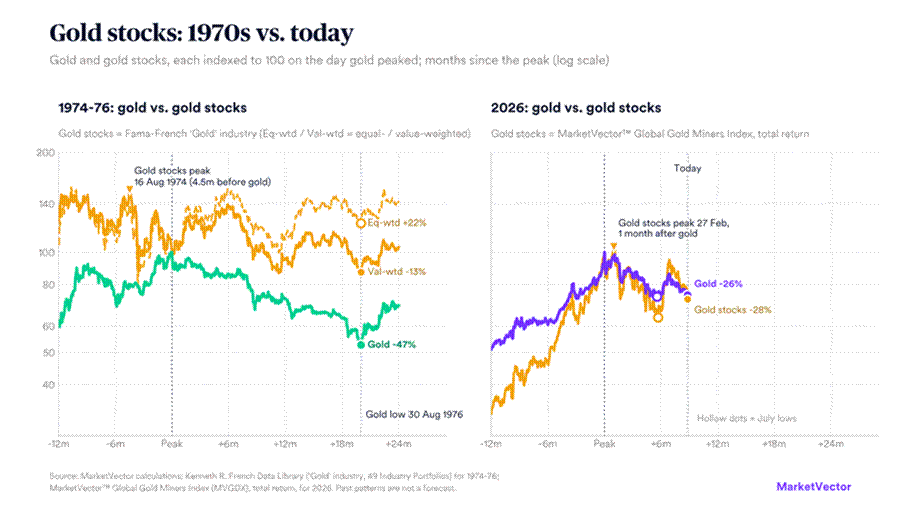
The other temptation is to use miners as a leading indicator. In 1974–76 gold stocks topped 4.5 months before bullion (16 August 1974) and bottomed 8.5 months before it (9 December 1975), holding that low while gold made a new one. In the three modern drawdowns, MVGDX peaked and bottomed within about a month of gold, with no lead. This year it peaked a month after gold, on 27 February. On that record, I would not use miners to call the low.
This time, gold stocks have been more resilient than in earlier drawdowns. At gold’s July low, MVGDX was 36% below its level on the day gold peaked, about 1.3 times gold’s 27% fall. In 2008, 2011–15 and 2020–22 miners ended up falling 1.7 to 2.5 times as much as bullion. The rebound from the July low was also sharper: miners rose 47% by late August against 17% for gold. Today MVGDX is 13.5% above its 20 July low, while gold is only 1% above its 16 July low, and the index is 30% below its February high against 26% for gold, a ratio of about 1.2.
Two readings are possible: miners are more resilient this time, or they have not yet paid for gold’s decline. Price alone cannot separate them, and three cautions apply. The earlier ratios describe completed drawdowns, while this one is still open. The cushion has narrowed, since between 21 and 23 October miners fell 7.3% against 2.9% for gold. And resilience has no predictive record here: in the three modern drawdowns, miners did not lead gold at its highs or lows. This is an observation about how this correction has behaved, not a forecast and not a recommendation to buy or sell any security. A close below about 2,520 on the total return index, roughly 12% below today’s level, would show whether the resilience holds, alongside gold’s 3,978.
Data note: the Fama-French Gold industry is a thin, US-listed portfolio rebuilt each June. The file does not show its constituents, so a few large names may drive the 1970s results. MVGDX is a global miners index. Both series include dividends.
What I am watching
- The July low (about $3,978). A close below it breaks the double bottom and favors the 1974-style stair-step. Reclaiming the August high (about $4,660) favors the 1976 clock.
- Real yields and the Fed’s path, starting with the October FOMC.
- Western ETF flows. Central banks are buying, but the marginal price today is set by investors who respond to real rates.
- Pace of official buying. Does it keep accelerating into weakness, as China’s did in September?
- Gold stocks against their July low (about 2,520 on the MVGDX total return index). A break would be the first stress test of the divergence.
The 1970s do not give us a forecast. They give us a map of what normal looks like, and what to check before declaring the correction over. By that map, the depth is normal, the duration is the open question, and the next few months should show which clock we are on.
This is pattern analysis on a single price series and not investment advice.
Sources and data
[1] China Daily HK, 7 Oct 2026: PBoC September gold purchase
[2] ING via FXStreet, 31 Jul 2026: Central bank buying offsets ETF outflows
[3] ICAEW: Chart of the week, US debt
[4] Newscoop ND fact brief: Has the national debt exceeded 100% of GDP?
Data: gold daily closes to 23 October 2026; MarketVector™ Global Gold Miners Index (MVGDX), total return, 2006 to 2026; Fama-French “Gold” industry portfolio (CRSP, Kenneth R. French Data Library), 1970s. The 1970s official gold sales, 2011–13 central-bank buying and 1970s macro backdrop come from background knowledge, not from a source file.
About the Author(s):
Martin Leinweber leads digital asset research and strategy at MarketVector Indexes, where he develops index products, publishes institutional research, and serves as the firm's primary voice on crypto markets to a global client base. His work sits at the intersection of systematic investing and an emerging asset class, translating rigorous quantitative frameworks into actionable insight for institutional investors. Before joining MarketVector, Martin spent nearly two decades as a Portfolio Manager across equities, fixed income, and alternative investments. At Quoniam Asset Management, one of Germany's foremost quantitative houses, he managed active funds for institutional clients including insurance companies, pension funds, and sovereign wealth funds. Earlier in his career at MEAG, the asset manager of Munich Re and ERGO, he contributed to the firm's international expansion, including the establishment of a joint venture with PICC, China's largest insurance company, with operations in Shanghai and Beijing. Martin is co-author of two Wiley publications: Asset-Allokation mit Kryptoassets: Das Handbuch (2021), the first institutional handbook on integrating digital assets into traditional portfolios, and Mastering Crypto Assets: Investing in Bitcoin, Ethereum, and Beyond (2024). He holds a Master of Economics from the University of Hohenheim and is a CFA Charterholder.
For informational and advertising purposes only. The views and opinions expressed are those of the authors but not necessarily those of MarketVector Indexes GmbH. Opinions are current as of the publication date and are subject to change with market conditions. Certain statements contained herein may constitute projections, forecasts, and other forward-looking statements that do not reflect actual results. It is not possible to invest directly in an index. Exposure to an asset class represented by an index is available through investable instruments based on that index. MarketVector Indexes GmbH does not sponsor, endorse, sell, promote, or manage any investment fund or other investment vehicle that is offered by third parties and that seeks to provide an investment return based on the performance of any index. The inclusion of a security within an index is not a recommendation by MarketVector Indexes GmbH to buy, sell, or hold such security, nor is it considered to be investment advice.
Get the latest news & insights from MarketVector
Get the newsletterRelated: