
Executive Summary
Every allocator underwriting the AI capex supercycle is running a single factor bet, whether they admit it or not. The technology and semiconductor names that carry the bulk of that theme have become the dominant source of both return and risk in institutional equity books, at precisely the moment the traditional shock absorber for concentrated equity risk, the government bond, has stopped doing its job. The decades long negative correlation between stocks and bonds broke down after 2022 and has not come back. On the data through August 13, 2026, the rolling one year correlation between SPY and IEF sits at +0.27, versus an average of roughly -0.40 across 2009 to 2021. Government bonds are no longer a reliable hedge for an AI drawdown; they now tend to fall alongside it.
This paper makes the case for a barbell response: stay long the AI growth engine, expressed through both MarketVector™ Top US Technology Companies Index (MVU5TK) and the MVIS US Listed Semiconductor 25 Index (MVSMH), but fund the position with four deliberately low correlated sleeves rather than a duration hedge. The case is made here for pairing AI exposure with Energy, Bitcoin, Health Care and Utilities, tested against MarketVector index history going back to 2018. The empirical result supports the thesis: Bitcoin, Energy and Utilities are three of the four lowest correlated assets to Technology within the entire MarketVector US sector suite, with Health Care not far behind. A model barbell weighted 35% Technology, 20% Semiconductors, 17% Health Care, 14% Utilities, 9% Energy and 5% Bitcoin captured roughly 79% of the pure AI growth engine's annualized return since December 2018 with about 26% less volatility, a better Sharpe ratio, and close to half of the growth engine's drawdown during the 2022 tech specific bear market.
This paper is written for institutional allocators sizing AI exposure and for index and ETF product teams evaluating whether a rules based barbell, long AI, hedged with Energy, Bitcoin, Health Care and Utilities, is a viable, benchmarkable strategy. It is not investment advice; it is a framework, and the weights below are illustrative rather than optimized. Both are laid out in full below.
1. The Underlying Portfolio Problem: The Breakdown of Stock-Bond Diversification
For most of the careers of everyone reading this, the fix for equity concentration risk was mechanical: buy duration. During the Zero Interest Rate Policy era, stock bond correlation was consistently negative. When equities sold off, Treasuries rallied, and a 60/40 portfolio absorbed the shock almost automatically. That relationship held for so long that it became an assumption baked into most risk models, and it is no longer true.[1]
Stock bond correlation was strongly negative for most of the last two decades because the dominant macro risk was growth. When growth wobbled, the Fed cut, bonds rallied, and equities eventually found a floor. Since 2022 the dominant macro risk has flipped to overheating and supply side inflation, an AI capex boom pulling on the same power and materials markets as an oil supply shock, rather than pure growth deceleration. In that kind of regime, bonds and stocks get pushed by the same force in the same direction: a hawkish inflation surprise hurts both. The current backdrop can be read through that lens: a Federal Reserve caught between a labor market that is loosening in its most cyclical corners and inflation that is being driven from the supply side, AI related capex demand and an oil shock tied to the Strait of Hormuz, rather than from the labor market the Fed's own framework is built to watch.
Figure 1: SPY-IEF Rolling 1-Year Correlation (2003-2026)
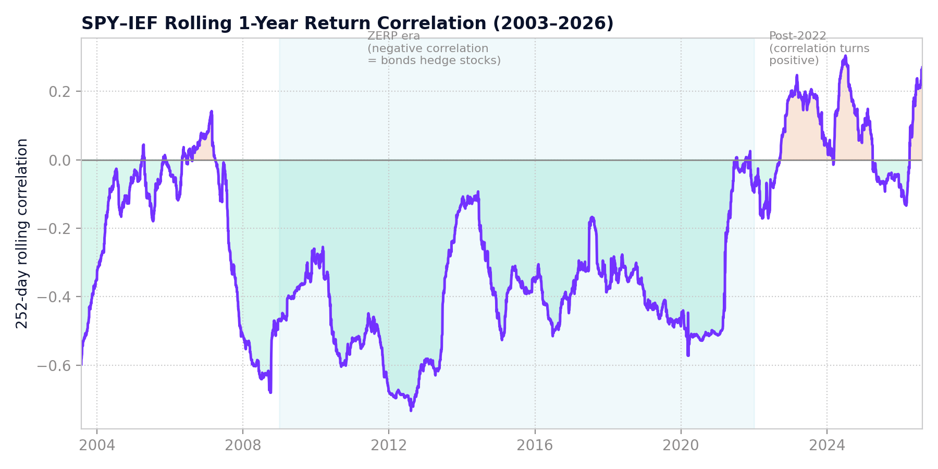
Exhibit 1. SPY-IEF rolling 252-day return correlation, 2003 to 2026. Source: BATS daily price data. Correlation has been positive on a trailing one-year basis in 24 of the last 45 months, versus persistently negative readings across 2009 to 2021.
2. The Growth Engine: AI, Technology and Semiconductors
None of this is an argument against owning the theme. We remain constructive on technology as the primary engine of equity upside, built on a specific and, in our view, testable thesis. After a year in which semiconductors and hyperscalers moved in opposite directions, chips rallying while cloud capex fears hit hyperscaler multiples, then reversing, the setup into the back half of 2026 is for both cohorts to re-couple to the upside as capex spend visibly converts into hyperscaler revenue. The real recipe for this market moving higher is both groups rallying together: as investors recognize that the capex spend is producing results at the hyperscaler level and cloud businesses are growing, GPU contracts roll over and off at much higher rental rates, and the market can get a genuine step change.
Real time tracking of GPU rental availability across the Neocloud ecosystem, something worth watching closely since 2023, when skepticism about the AI trade was still the consensus view, is the evidentiary backbone of that call. Rather than take capex announcements at face value, sampling compute availability directly shows a persistent, tightening bid for GPU capacity rather than the overbuild the bear case requires. On that basis, AI ecosystem annual recurring revenue could roughly double from current levels to approach $200 billion exiting 2026.
The tactical entry point matters as much as the structural call. Semiconductors went through a violent shakeout in early 2025: the MVIS US Listed Semiconductor 25 Index peaked in late January, fell 32.7% into the April 8, 2025 tariff driven selloff, then fully recovered to a new high within about ten weeks. That kind of sharp, fast drawdown followed by an equally fast round trip is the signature of a sentiment washout rather than a trend change, and it is worth keeping in mind given how quickly semiconductor sentiment can swing in either direction. MVSMH, has a live history back to September 2000, so it has been through the dot com bust, the global financial crisis and the 2022 rate shock, not just this cycle. Over the window used throughout this paper, December 2018 to August 2026, it returned 41.8% annualized with 36.6% annualized volatility and a maximum drawdown of 45.3%, meaningfully more volatile than broad Technology but also the more direct way to express the AI capex and GPU thesis, which is why it is used alongside broad Technology in the backtest from Section 5 onward.
The growth leg of the barbell is taken as given. This paper is not a semiconductor pick; it is a portfolio construction exercise built around the assumption that AI and technology exposure, expressed here as a blend of broad Technology and the Semiconductor 25 index, remains the dominant source of equity beta and the dominant source of concentration risk in institutional books through the remainder of this cycle.
3. Four Hedges Against Concentrated AI Exposure
If bonds no longer reliably hedge a tech heavy book, the barbell needs sleeves whose return drivers are genuinely distinct from AI capex sentiment. Four are identified here, each addressing a different channel through which the AI trade could disappoint, or a different reason its winners might not be the names everyone already owns: a geopolitical and physical supply channel (Energy), a monetary and fiscal channel (Bitcoin), a downstream productivity channel (Health Care), and a physical power and infrastructure channel (Utilities).
3.1 Energy: the supply-side inflation and geopolitical hedge
The AI trade's biggest tail risk is not a demand shock; it is a supply shock arriving through the energy complex. This barbell pairs AI equity exposure with an energy overweight, specifically to hedge the scenario in which geopolitical escalation (the Strait of Hormuz, Russia and Ukraine refinery strikes) collides with an AI capex cycle that is itself power and materials intensive. Oil looks like a no brainer hedge here. The AI infrastructure build out is worth owning, but the risk of an oil spike tied to the Strait of Hormuz is worth hedging separately rather than hoping it does not happen.
In practice, this hedge is expressed through energy equities rather than oil futures directly. An energy sector equity index is easier to hold, rebalance and combine with the rest of an equity book than a commodity index, and energy producers carry embedded operating leverage to the underlying commodity that can amplify the hedge in a genuine supply shock. That is also the proxy used later in the backtest: a broad Energy sector equity index, not a commodity index, standing in for this leg of the barbell.
The supply side data backs the qualitative case up. Global oil inventories, SPR, commercial and floating storage combined, have been drawn down roughly 15% during the current crisis, and refined products (diesel, jet fuel) sit at multi decade seasonal lows because the constraint has shifted from crude availability to refining capacity, which cannot be solved by releasing barrels from storage. For a barbell built to protect AI exposure, this is the leg that hedges the scenario where the AI story itself becomes an inflation and cost of capital problem via energy prices, rather than a valuation problem via rates.
3.2 Bitcoin: the monetary scarcity hedge
The second channel is not physical, it is monetary. The AI buildout is being financed with an extraordinary and rapidly growing amount of debt and circular vendor financing, against a fiscal backdrop that, in our view, is the real source of the current inflation impulse. Today's inflation traces less to an overheating labor market than to post 2021 deficit spending, procyclical fiscal policy that the Fed's rate hikes have only partially offset. In a world of persistent fiscal dominance, and increasingly of AI driven abundance in the goods and information economy, scarce assets, not fiat denominated ones, are the place to hide. If money printing is effectively unconstrained and AI is pushing large parts of the economy toward abundance, fiat denominated assets should structurally underperform scarce ones, and Bitcoin is the crypto asset with the highest confidence of still mattering in ten years.
The framing here is a relative value one rather than a purely technological one. Size the opportunity by comparing the roughly $750 trillion in global assets to crypto's roughly $2.7 trillion market capitalization, and Bitcoin functions as something like the S&P 500 of the asset class: an amorphous, survivorship selected repository that absorbs excess wealth created and destroyed across thousands of other tokens, rather than a bet on any single technology roadmap. It is telling that some of the most convinced holders in this space have never sold since first buying Bitcoin, even while also holding Ethereum against the tokenization and stablecoin narrative. Bitcoin remains the one crypto holding that is genuinely uncorrelated to any single project's execution risk.
That same instinct, rotating out of assets exposed to abundance and into scarcity, shows up on the commodity side too: a shift out of memory chip stocks and into silver, gold and copper this year, and away from software businesses that AI is likely to disrupt. Whether the entry point is commodities or crypto, the conclusion is the same. Own scarcity, and hedge the AI and deficit driven monetary backdrop directly rather than hoping duration does the job.
For the barbell, Bitcoin is sized as the smallest of the four hedge sleeves, deliberately, because its volatility is so much higher than the other three. It is also, on the data below, the single least correlated asset to Technology and to every other MarketVector US sector index in this dataset. The qualitative case made above for energy and duration turns out, empirically, to be strongest in Bitcoin.
3.3 Health Care: the AI productivity hedge
The third leg of the barbell is not really a hedge against AI failing. It is a bet on a specific and, in our view, underappreciated way AI succeeds. Health care sits on some of the richest, most proprietary data of any industry: clinical trial records, genomic sequencing, electronic health records, medical imaging archives, most of it still barely touched by machine learning. That combination of data depth and complexity is exactly the kind of problem large models are best suited to compress, and health care, in our view, has the highest AI driven productivity upside of any non technology sector precisely because of it.
Eli Lilly is already one of the largest enterprise AI spenders in the economy, using it across drug discovery and clinical trial design, and healthcare's chart action, breaking out even as tech and broad equities chopped through the summer, reads as the market starting to price in that productivity story rather than treating healthcare as a purely defensive sector. Health Care is the odd sleeve out in the barbell in one respect: unlike Energy, Bitcoin and Utilities, it is not primarily a diversifier against equity beta (its correlation to the broad US market is a moderately high 0.77 in this dataset). Its role is different. It is a structurally distinct AI adjacent growth story, one that runs on data and drug discovery timelines rather than on capex and GPU rental rates, and on the data it is still meaningfully less correlated to Technology than most other sectors. That combination, genuine diversification within the AI theme without giving up the theme entirely, is exactly the property a barbell hedge sleeve needs.
3.4 Utilities: the AI power and baseload hedge
The fourth channel addresses a constraint that gets less attention than compute itself: power. Agentic AI inference and centralized model training cannot run purely on intermittent renewables without an enormous amount of battery storage that does not yet exist at scale. Utilities able to offer reliable baseload power, nuclear, natural gas, regulated dispatch, hold real structural pricing power in a world where hyperscalers are competing for every available megawatt.
Macro allocators have traditionally treated utilities as an interest rate sensitive, low growth dividend proxy, essentially a bond substitute. In our view, AI changes that. Power producers are shifting toward secular growth multiples as long term power purchase agreements with hyperscalers de-risk their capital spending, which looks like a genuine re-rating catalyst rather than a cyclical bounce. Utilities also offer a kind of downside shield that traditional software does not: seat based software revenue is exposed to margin compression as agents automate more of the work software licenses used to charge for, while utilities with unregulated, merchant or rate base assets benefit from inelastic enterprise demand for power regardless of which application layer ultimately wins.
On the data, Utilities is the second least correlated sector to Bitcoin in the entire MarketVector suite at 0.08, and one of the more moderately correlated sectors to Technology at 0.39, well below the broad market's 0.83 correlation to Technology. That combination of a structural AI power thesis and genuinely low correlation to the growth engine is what earns Utilities a place in the barbell alongside Energy, Bitcoin and Health Care.
4. Why It Works: The Correlation Evidence
Conviction is a starting point, not a portfolio. We tested the barbell logic against MarketVector's own US sector total return indexes, the MVIS US Listed Semiconductor 25 Index, and MarketVector's Bitcoin benchmark rate (BBR), aligned to a common weekday trading calendar from December 2018 to August 2026. The result is a clean confirmation of the thesis.
Figure 2: MarketVector US Sector Indexes, Semiconductors & Bitcoin
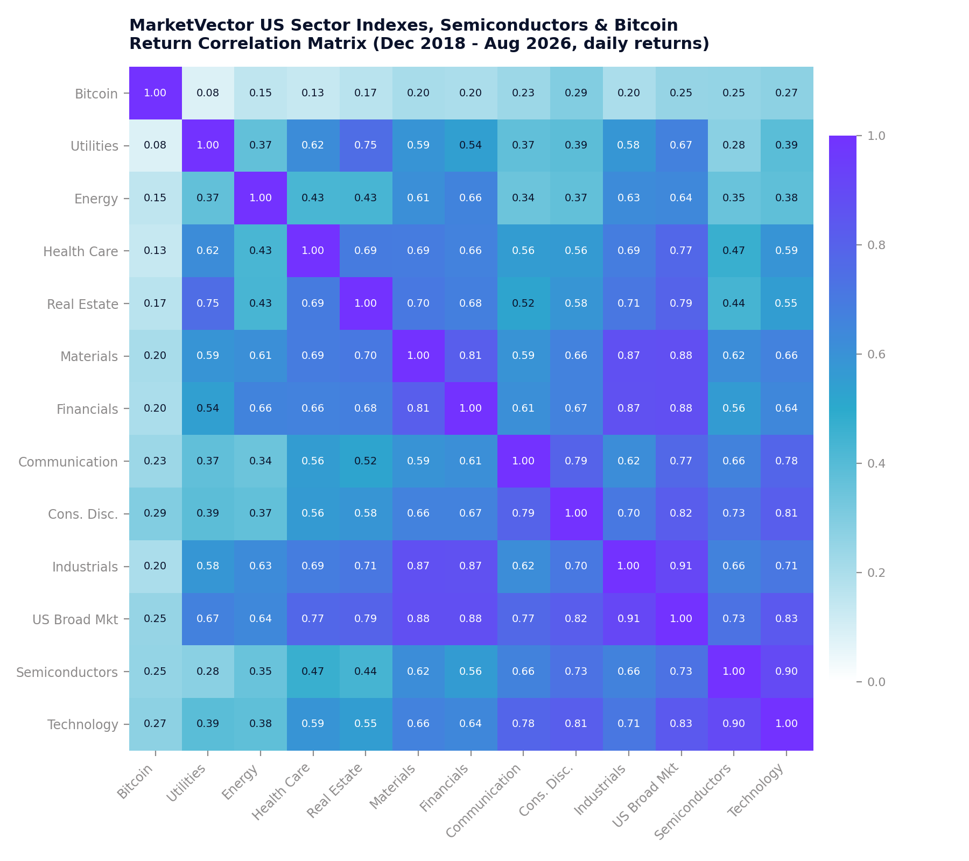
Exhibit 2. Daily return correlation matrix, MarketVector US sector total-return indexes, the Semiconductor 25 index and Bitcoin, Dec 31 2018 to Aug 13 2026.
Two results stand out. First, Bitcoin is the least correlated asset to every single sector in the matrix, Semiconductors and Technology included: its correlation to Technology is 0.27, to Semiconductors is 0.25, and to the broad US market is 0.25, roughly a third of the co-movement any two equity sectors typically show with each other. Second, and more specific to this paper's thesis, Technology's four least correlated counterparts across the entire universe are Bitcoin (0.27), Energy (0.38), Utilities (0.39) and Real Estate (0.55), with Health Care close behind at 0.59. Real Estate does not carry a coherent AI thesis in either direction, so it is not part of the barbell; Bitcoin, Energy, Utilities and Health Care are, and each earns its place both empirically, by sitting near the bottom of Technology's correlation table, and qualitatively, through the distinct channel described in Section 3. The barbell is not an arbitrary pairing of four plausible sounding hedges; it is, on this data, close to the empirically optimal combination available within the MarketVector sector suite.
5. Constructing the Barbell: A Model Portfolio
We size the barbell as a 55% AI growth sleeve funded against a 45% hedge basket. The growth sleeve itself is not a single index: it splits 35% broad Technology and 20% Semiconductor, so the sleeve keeps the diversification of a full technology sector alongside a direct, concentrated line to the chip and GPU names driving the capex cycle described in Section 2. The hedge basket is split across Energy, Health Care, Utilities and Bitcoin in inverse proportion to each asset's own realized volatility, a standard risk parity heuristic that keeps Bitcoin's roughly 60% annualized volatility from dominating the hedge sleeve's risk budget while still giving it a meaningful, deliberate allocation. The resulting weights are shown below.
Figure 3: The AI Barbell Model Portfolio
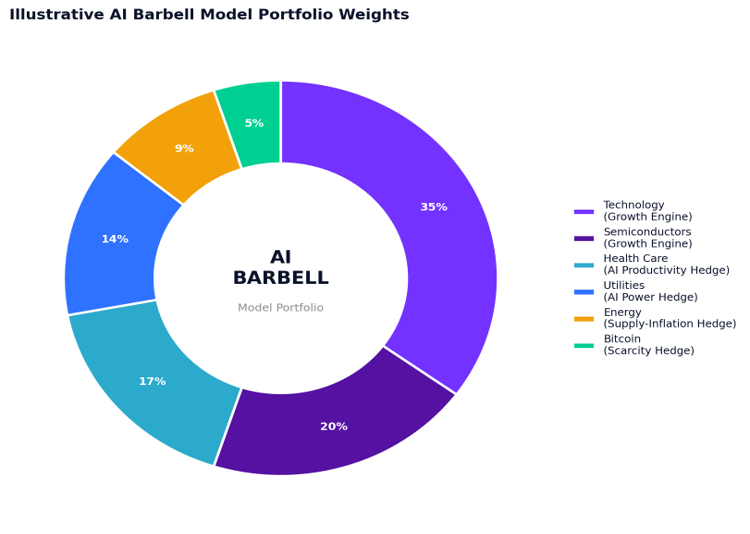
Exhibit 3. Illustrative AI Barbell model portfolio: 35% Technology / 20% Semiconductors / 17% Health Care / 14% Utilities / 9% Energy / 5% Bitcoin.
Table 1: Portfolio Overview
Sleeve |
Role in the Barbell |
Weight |
Ann. Vol (2018-2026) |
|---|---|---|---|
Growth engine |
35% |
27.1% |
|
Growth engine |
20% |
36.6% |
|
AI productivity hedge |
17% |
17.7% |
|
AI power hedge |
14% |
21.0% |
|
Supply-inflation/geopolitical hedge |
9% |
31.8% |
|
Monetary scarcity hedge |
5% |
60.2% |
The 5% Bitcoin weight sits inside the 1% to 5% range typically cited as a starting allocation in institutional Bitcoin adoption surveys, and reflects its very high realized volatility once that volatility is measured on a consistent, weekday aligned basis across every asset in the barbell. It remains the single lowest correlation asset in the entire matrix, so even a modest weight contributes a disproportionate diversification benefit. Allocators with more risk budget or higher conviction on Bitcoin specifically can size it up and fund that from Technology or Semiconductors without changing the basic structure of the barbell. These weights are presented as a starting point, not as an optimized or risk managed allocation. See Section 7.
6. Backtested Behavior, December 2018 to August 2026
We simulated the model barbell with monthly rebalancing back to the constant target weights, using MarketVector's Technology and Semiconductor 25 indexes, its Health Care, Utilities and Energy sector total return indexes, and its Bitcoin benchmark rate as the six building blocks, against two reference points: a 100% AI growth engine blend (63.6% Technology, 36.4% Semiconductors, the same relative proportions as inside the barbell), and the broad US equity market.
Figure 4: AI Barbell vs. Pure AI Growth Engine Exposure
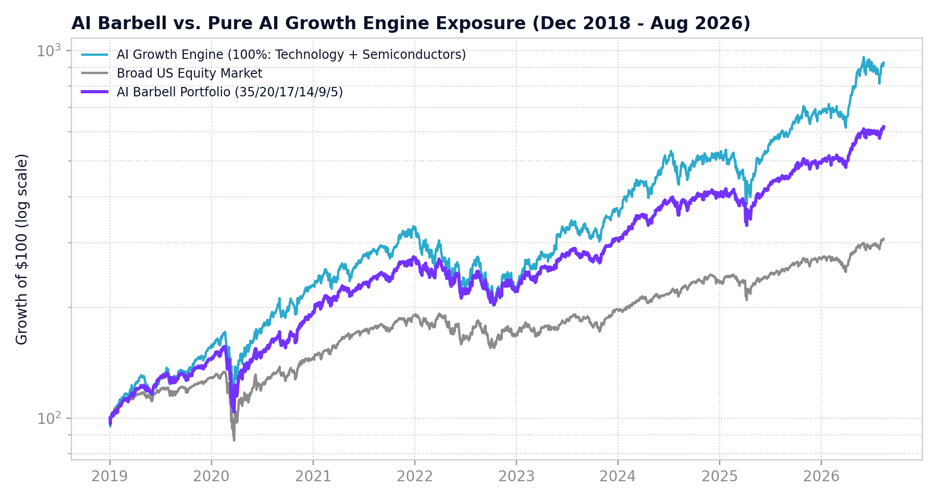
Exhibit 4. Growth of $100, log scale, Dec 31 2018 to Aug 13 2026. Monthly-rebalanced barbell (35/20/17/14/9/5) vs. 100% AI growth engine vs. broad U.S. equity market.
Table 2: The Portfolio Metrics
Strategy |
Ann. Return |
Ann. Vol |
Sharpe (rf=0) |
Max Drawdown |
|---|---|---|---|---|
AI Barbell (35/20/17/14/9/5) |
26.5% |
22.0% |
1.21 |
-33.7% |
100% AI Growth Engine |
33.7% |
29.8% |
1.13 |
-38.4% |
Broad U.S. Equity Market |
16.5% |
18.5% |
0.89% |
-35.0% |
The headline result: the barbell captured 79% of the pure growth engine's annualized return (26.5% versus 33.7%) while cutting annualized volatility by roughly 26% (22.0% versus 29.8%) and, notably, improving the Sharpe ratio to 1.21 from 1.13. On this data the barbell is not just less volatile than the pure AI trade, it is also more efficient on a risk adjusted basis. The peak to trough maximum drawdown is more differentiated than in the return and volatility figures: the barbell's worst drawdown was 33.7%, better than both the growth engine's 38.4% and the broad market's 35.0%, though all three still bottomed within days of each other in March 2020, when a systemic, indiscriminate liquidity event hit every asset class at once regardless of fundamentals. That caveat matters and is revisited in Section 7.
The more relevant test is a tech specific, non-systemic drawdown, precisely the scenario the barbell is built for. The 2022 Fed hiking cycle was a valuation driven bear market concentrated in long duration growth equity, not a systemic liquidity event, and the barbell's behavior that year is the cleanest evidence for the thesis in the whole dataset.
Figure 5: The Barbell in a Tech-Specific Bear Market
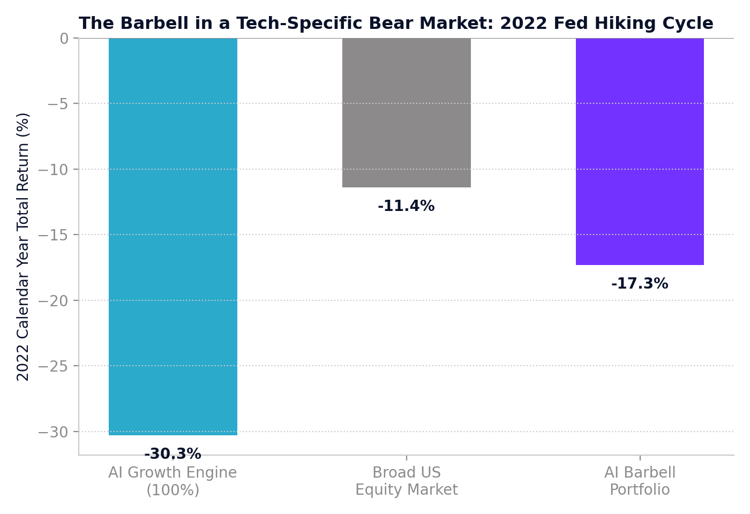
Exhibit 5. Calendar-year 2022 total return: 100% AI growth engine vs. broad market vs. the AI Barbell.
The AI growth engine fell 30.3% in 2022 as rates repriced growth multiples, with Semiconductors alone down 33.4%. The broad market, with its lower tech weight, fell a more modest 11.4%. The barbell fell 17.3%, a little more than half of the growth engine's decline, while still carrying a 55% weight to the two sectors driving the sell-off. A similar, smaller scale pattern shows up in the April to July 2025 window referred to here as the semiconductor volatility washout period: the growth engine drew down 14.0% intra period before rallying to +31.7% by period end, while the barbell's trough was a shallower 11.9% but its recovery was more muted at +17.4%, consistent with a hedge sleeve that gives up some upside in a V-shaped tech rally in exchange for a meaningfully shallower drawdown on the way in.
7. Risks and Limitations
This is a framework, not a finished product, and it carries risks that should be made explicit before anyone sizes it.
- Systemic drawdowns are not addressed. As 2020 shows, when a liquidity shock forces indiscriminate selling across every asset class, the barbell's correlation advantages compress and it draws down alongside everything else. The barbell hedges idiosyncratic AI and tech risk, not tail risk to the entire risk asset complex.
- Bitcoin's volatility and drawdown profile are extreme in isolation. Over the sample period Bitcoin's annualized volatility was roughly 60% with a peak to trough drawdown of -76.4%. Its low correlation is a portfolio level property; held on its own it is one of the most volatile assets in any institutional universe, and governance, custody and mandate constraints will rule out a direct holding for many institutional allocators (a regulated Bitcoin index linked product is one way to bridge that gap).
- Semiconductors and Technology are highly correlated to each other, 0.90 in this dataset, so the growth sleeve is less internally diversified than the barbell as a whole. The Semiconductor 25 index also carries the highest volatility and drawdown of any equity sleeve in this paper, 36.6% annualized volatility and a 45.3% maximum drawdown over this period, which is the trade off for its more direct exposure to the AI capex cycle.
- The debt financing risk inside the AI trade itself is real, if not yet acute. Rolling 252-day corporate issuance in technology and communications services is rising quickly, though it remains below 2021's zero rate era levels. A disorderly repricing of AI capex financing would likely hit Technology and Semiconductors, and potentially Bitcoin and risk sentiment broadly, at the same time, partially undermining the hedge.
- The Health Care thesis depends on AI actually delivering measurable productivity gains in drug discovery and clinical operations within a reasonable timeframe. If enterprise AI adoption in health care disappoints, or regulatory approval cycles remain the binding constraint regardless of AI, Health Care's role reverts to a lower beta defensive sector rather than an AI linked productivity story.
- The Utilities thesis depends on the baseload power constraint remaining binding and on regulators continuing to approve long term power purchase agreements on favorable terms. A faster than expected buildout of grid capacity, battery storage or small modular reactors would reduce Utilities' structural pricing power and pull the sector back toward its traditional bond proxy behavior.
- Weights are illustrative and static. They were not optimized for a target volatility, tracking error or drawdown budget, and correlations are estimated over a single, unusually AI dominated sample period. Treat the 35/20/17/14/9/5 split as a starting point for further optimization, not a finished allocation.
- Geopolitical calls, including the Strait of Hormuz outlook and the trajectory of Russia and Ukraine refinery strikes, are inherently uncertain and reflect a single reading of the situation, not a MarketVector house forecast.
8. Conclusion: Implications for Allocators and ETF Issuers
The stock bond hedge is not coming back on the timeline most institutional risk models still assume, and an AI concentrated equity book needs a replacement shock absorber built from assets that fail for different reasons than the AI trade itself. The evidence here, both the qualitative argument and the quantitative correlation and drawdown data across the MarketVector index history used in this paper, points to the same four sleeves: Energy against the geopolitical and supply side inflation tail, Bitcoin against the monetary and fiscal tail, Health Care as a genuine AI productivity beneficiary with low correlation to the rest of the trade, and Utilities against the physical power and infrastructure constraint AI is running into.
For asset allocators, the near term action is straightforward: audit how much of the equity book's realized volatility over the last two years has come from AI and technology names, and size a genuinely low correlated hedge basket, not incremental duration, against that concentration. For ETF issuers and index product teams, the barbell construction outlined here is directly benchmarkable. A rules based, quarterly rebalanced index combining Technology and Semiconductor 25 sleeves with Energy, Health Care, Utilities and a regulated Bitcoin benchmark is a buildable, transparent product architecture, differentiated from both a plain vanilla tech fund and a plain vanilla multi asset hedge fund replicator. This framework will continue to be tested and refined as more history accumulates, and we welcome the dialogue with allocators and issuers evaluating it.
Appendix: Data and Methodology
Sources. All series are aligned to a common weekday trading calendar before computing returns, correlations and the backtest, since the underlying data otherwise carries forward flat weekend values that would understate volatility if left in the sample.
Correlation matrix (Exhibit 2). Computed on daily simple returns over the common weekday window in which Technology (MVU5TK), Semiconductors (MVSMH), Health Care (MVU5HC), Utilities (MVU5UT), Energy (MVU5EY) and Bitcoin (BBR) are all populated: December 31, 2018 to August 13, 2026 (1,915 observations).
SPY-IEF correlation (Exhibit 1). Computed on daily simple returns of adjusted close prices, rolling 252 trading day window, over the full common history of both instruments: July 26, 2002 to August 13, 2026.
Backtest (Exhibits 4 and 5, Section 6 tables). Constant weight, monthly rebalanced simulation using daily total returns for Technology (MVU5TK), Semiconductors (MVSMH), Health Care (MVU5HC), Utilities (MVU5UT), Energy (MVU5EY) and Bitcoin (BBR), over December 31, 2018 to August 13, 2026, aligned to the common weekday calendar described above. Between rebalance dates, weights are allowed to drift with realized returns. Annualized return and volatility are computed from daily simulated portfolio returns (252-day convention); Sharpe ratio assumes a zero-risk free rate for comparability across strategies; maximum drawdown is peak to trough on the cumulative daily return series. This is a research simulation, not a live or audited index; it excludes transaction costs, taxes and fees.
[1] For more info, read our paper the new 60/40 portfolio
About the Author(s):
Martin Leinweber leads digital asset research and strategy at MarketVector Indexes, where he develops index products, publishes institutional research, and serves as the firm's primary voice on crypto markets to a global client base. His work sits at the intersection of systematic investing and an emerging asset class, translating rigorous quantitative frameworks into actionable insight for institutional investors. Before joining MarketVector, Martin spent nearly two decades as a Portfolio Manager across equities, fixed income, and alternative investments. At Quoniam Asset Management, one of Germany's foremost quantitative houses, he managed active funds for institutional clients including insurance companies, pension funds, and sovereign wealth funds. Earlier in his career at MEAG, the asset manager of Munich Re and ERGO, he contributed to the firm's international expansion, including the establishment of a joint venture with PICC, China's largest insurance company, with operations in Shanghai and Beijing. Martin is co-author of two Wiley publications: Asset-Allokation mit Kryptoassets: Das Handbuch (2021), the first institutional handbook on integrating digital assets into traditional portfolios, and Mastering Crypto Assets: Investing in Bitcoin, Ethereum, and Beyond (2024). He holds a Master of Economics from the University of Hohenheim and is a CFA Charterholder.
IMPORTANT DEFINITIONS AND DISCLOSURES
Copyright © 2026 by MarketVector Indexes GmbH (‘MarketVector’) All rights reserved. The MarketVector family of indexes (MarketVectorTM, Bluestar®, MVIS®) is protected through various intellectual property rights and unfair competition and misappropriation laws. MVIS® is a registered trademark of Van Eck Associates Corporation that has been licensed to MarketVector. MarketVectorTM and MarketVector IndexesTM are pending trademarks of Van Eck Associates Corporation. BlueStar®, BlueStar Indexes®, BIGI®, and BIGITech® are trademarks of MarketVector Indexes GmbH.
Redistribution, reproduction, and/or photocopying in whole or in part are prohibited without written permission. All information provided by MarketVector is impersonal and not tailored to the needs of any person, entity, or group of persons. MarketVector receives compensation in connection with licensing its indexes to third parties. You require a license from MarketVector to launch any product that is linked to a MarketVectorTM Index to use the index data for any business purpose and all use of the MarketVectorTM name or name of the MarketVectorTM Index. The past performance of an index is not a guarantee of future results.
It is not possible to invest directly in an index. Exposure to an asset class represented by an index is available through investable instruments based on that index. MarketVector does not sponsor, endorse, sell, promote, or manage any investment fund or other investment vehicle that is offered by third parties and that seeks to provide an investment return based on the performance of any index. MarketVector makes no assurance that investment products based on the index will accurately track index performance or provide positive investment returns. MarketVector is not an investment advisor, and it makes no representation regarding the advisability of investing in any such investment fund or other investment vehicle. A decision to invest in any such investment fund or other investment vehicle should not be made in reliance on any of the statements set forth in this document.
Investments into cryptocurrencies and/or digital assets are subject to material and high risk including the risk of total loss. The calculated prices may not be achieved by investors as the calculated price is based on prices from different trading platforms. Furthermore, an investment into cryptocurrencies and/or digital assets may become illiquid depending on the trading platform or investment product used for the specific investment. Investors should carefully review all risk factors disclosed by the relevant trading platform or in the product documents of relevant investment products.
Prospective investors are advised to make an investment in any such fund or other vehicle only after carefully considering the risks associated with investing in such funds, as detailed in an offering memorandum or similar document that is prepared by or on behalf of the issuer of the investment fund or other vehicle. The inclusion of a security within an index is not a recommendation by MarketVector to buy, sell, or hold such security, nor is it considered to be investment advice.
All information shown prior to the index launch date is simulated performance data created from backtesting ("Simulated past performance”). Simulated past performance is not actual but hypothetical performance based on the same or fundamentally the same methodology that was in effect when the index was launched. Simulated past performance may materially differ from the actual performance. Actual or simulated past performance is no guarantee for future results.
These materials have been prepared solely for informational purposes based upon information generally available to the public from sources believed to be reliable. No content contained in these materials (including index data, ratings, credit-related analyses and data, model, software, or other application or output therefrom) or any part thereof (Content) may be modified, reverse-engineered, reproduced or distributed in any form by any means, or stored in a database or retrieval system, without the prior written permission of MarketVector. The Content shall not be used for any unlawful or unauthorized purposes. MarketVector and its third-party data providers and licensors (collectively “MarketVector Parties”) do not guarantee the accuracy, completeness, timeliness, or availability of the Content. MarketVector Parties are not responsible for any errors or omissions, regardless of the cause, for the results obtained from the use of the Content. THE CONTENT IS PROVIDED ON AN “AS IS” BASIS. MARKETVECTOR PARTIES DISCLAIM ANY AND ALL EXPRESS OR IMPLIED WARRANTIES, INCLUDING, BUT NOT LIMITED TO, ANY WARRANTIES OF MERCHANTABILITY OR FITNESS FOR A PARTICULAR PURPOSE OR USE, FREEDOM FROM BUGS, SOFTWARE ERRORS, OR DEFECTS, THAT THE CONTENT’S FUNCTIONING WILL BE UNINTERRUPTED OR THAT THE CONTENT WILL OPERATE WITH ANY SOFTWARE OR HARDWARE CONFIGURATION. In no event shall MarketVector Parties be liable to any party for any direct, indirect, incidental, exemplary, compensatory, punitive, special, or consequential damages, costs, expenses, legal fees, or losses (including, without limitation, lost income or lost profits and opportunity costs) in connection with any use of the Content even if advised of the possibility of such damages.
Get the latest news & insights from MarketVector
Get the newsletterRelated:
Most popular
-
 Commentary
How Rising Rates Can Impact Equity Returns
-
 Commentary
The Space Economy Is Taking Off