
Executive Summary
Every mature asset class eventually converges on a benchmark that defines “the market.” For US equities that benchmark is the S&P 500: broad enough to represent the whole economy, selective enough to be investable, and rebalanced often enough to keep up with it. Digital assets have reached the same point. Spot bitcoin ETFs hold more than $100bn, stablecoins have become a regulated dollar product in the United States, and the US Securities and Exchange Commission (SEC) now allows multi-asset crypto products to list under generic standards. What is missing is a single, rules-based measure of the asset class beyond bitcoin. This paper argues that the Coinbase 50 Index (COIN50) fills that gap.
50% Bitcoin’s weight in COIN50: the anchor, capped at 50% at every quarterly rebalancing |
88% of the non-bitcoin weight sits in networks that carry stablecoins and tokenized assets |
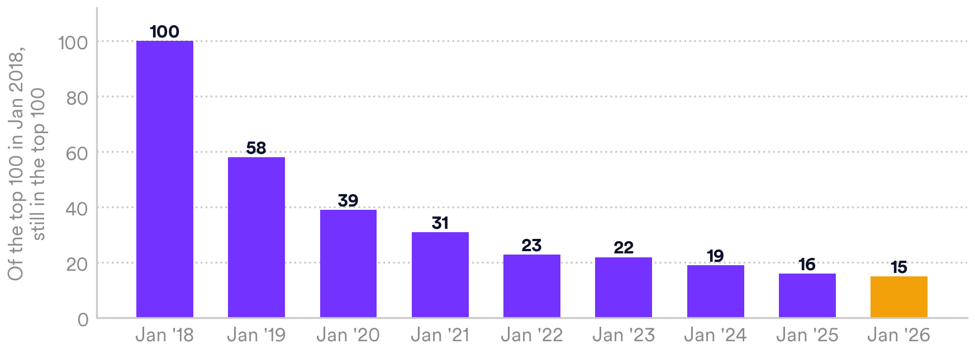
15 of the top 100 coins of January 2018 are still in the top 100 today |
0.95 return/risk of a 60/35/5 portfolio with COIN50, vs 0.81 for a classic 60/40 |
|---|
Five reasons the Coinbase 50 fits that role:
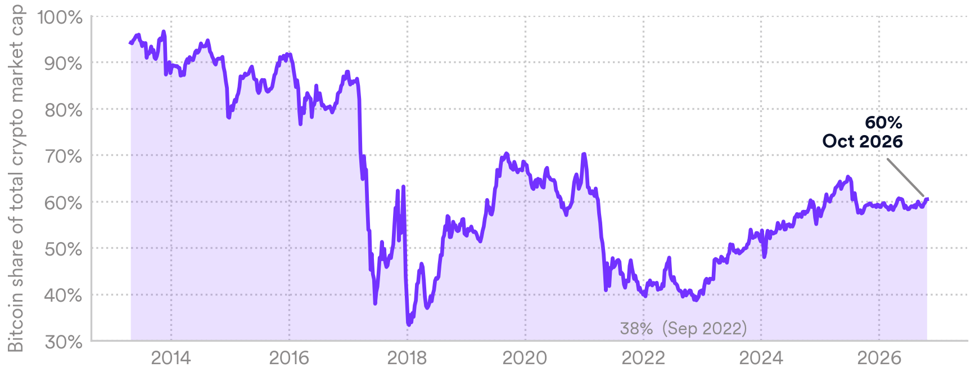
- Bitcoin is the anchor, not the whole market. Bitcoin’s share of crypto market value has swung between 38% and 72% since 2021. A bitcoin-only allocation is a bet that the rest of the market stays irrelevant.
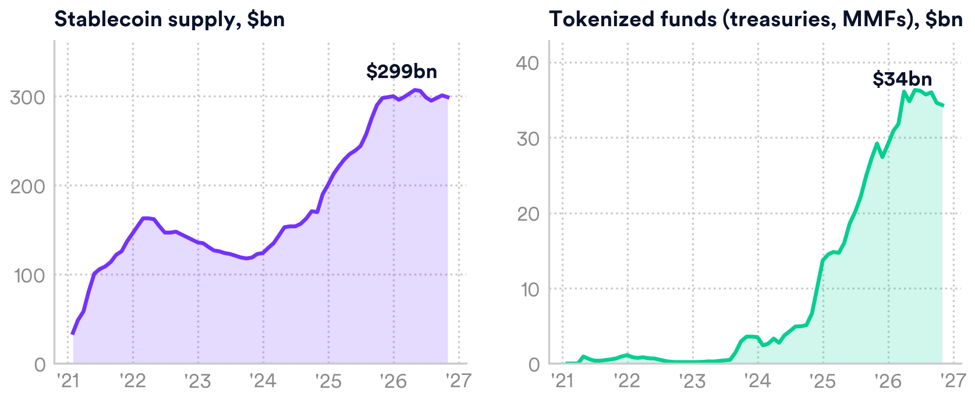
- The growth is happening on the networks behind the other half. Stablecoin supply has grown roughly ninefold since January 2021 to $299bn, and tokenized funds tenfold since January 2024 to $34bn. Most of it settles on networks that are COIN50 constituents.
- Winners rotate, and nobody picks them reliably. Only 3 of the top 10 of January 2018 are still in the top 10. A rules-based index with quarterly reconstitution adds the next generation automatically (26 additions in the last eight quarters).
- Large and liquid is where the investable returns were. In our 12-year study, large caps compounded at 56% a year; liquidity-screened small caps lost money. COIN50 constituents make up about 90% of the value of the top-100 coins, at the liquid end of the market.
- It behaves like the market and is built like a benchmark. Since December 2020 COIN50 returned +224% vs +191% for bitcoin with a similar drawdown profile. It is owned by Coinbase, administered by MarketVector under IOSCO principles, and priced from volume weighted rates across whitelisted exchanges.
1. The Benchmark Moment: Every Asset Class Gets its S&P 500
Indexes come after adoption, then accelerate it.
Charles Dow published the first stock average in 1884. Standard Statistics launched a 90-stock daily index in 1926, and it took until 1957 for that idea to become the S&P 500. The first retail index fund followed in 1976 and was dismissed at the time as un-American. Today the S&P 500 is the reference point for US equities: managers are measured against it, products are built on it, and “the market” means it.
Three things made the S&P 500 the standard, and none of them was that it held every stock:
- Representative. It covers roughly 80% of US equity market value, so it moves with the economy rather than with one company.
- Investable. It holds only companies large and liquid enough for institutions to trade.
- Self-renewing. A committee replaces 10–30 names a year. The index added Tesla in 2020 and Palantir in 2024; its holders got both without having to pick them.
Crypto is now at the stage US equities reached in the 1950s. The infrastructure exists, with spot ETFs, regulated custody and federal stablecoin law, but the asset class is still mostly accessed one coin at a time. US spot bitcoin ETFs held about $106bn in mid-October 2026, while the first multi-asset spot crypto ETFs in the US hold ten assets or fewer. The next step is the one equities took: from owning the biggest name to owning the market.
Table 1: S&P 500 vs Coinbase 50
|
S&P 500 (US equities) |
Coinbase 50 (digital assets) |
Universe |
US-listed companies |
Assets traded spot on Coinbase Exchange with a USD, USDC or USDT pair |
Eligibility screens |
Size, liquidity, free float, profitability |
Token economics, blockchain architecture, security and custody, 360 days since launch |
Constituents |
500 |
50 |
Market coverage |
~80% of US market cap |
~90% of top-100 crypto market cap ex-stablecoins |
Weighting |
Float-adjusted market cap |
Market cap, single-asset cap of 50% |
Reconstitution |
Quarterly rebalance, committee changes |
Quarterly (Feb, May, Aug, Nov), fully rules-based with a 41–60 buffer |
Governance |
S&P Dow Jones Indices |
Owner: Coinbase. Administrator: MarketVector Indexes (IOSCO principles) |
Source: MarketVector Indexes, Coinbase 50 Index Guide v1.03 (Aug 2026), S&P Dow Jones Indices. COIN50 coverage: constituent market cap as a share of the top-100 crypto universe excluding stablecoins and wrapped tokens, as of 21 Oct 2026.
Why now: the US rulebook has caught up
- Stablecoins have a federal framework.The GENIUS Act, signed in July 2025, takes effect by January 2027; the Office of the Comptroller of the Currency (OCC) has finalised its issuer rules.
- Listing is standardised.In September 2025 the SEC approved generic listing standards for commodity-based ETPs, including digital assets, replacing case-by-case approval.
- Classification is clearer.In March 2026 the SEC and the Commodity Futures Trading Commission (CFTC) issued a joint interpretive release setting out a five-category token taxonomy.
2. Bitcoin is the Anchor, Not the Market
A bitcoin-only allocation is a bet that the other 40% of crypto stays irrelevant.
Bitcoin is the asset class’s reserve asset and its most liquid market, and it should be the largest position in any crypto benchmark. In COIN50 it is, capped at 50% of the index at every quarterly rebalancing. But bitcoin’s share of the market is not stable. It has ranged from 92% (2016) to 33% (January 2018); since 2021 alone it has moved between 72% and 38%, and it is back to about 60% today, the result of a bitcoin-led cycle driven by spot ETF demand. An investor who holds only bitcoin is implicitly betting on where that line goes next.
Figure 1: Bitcoin dominance has never been a constant
Source: MarketVector Indexes. Weekly data, 28 Apr 2013 to 21 Oct 2026.
The market beyond bitcoin is broad. Our State of Crypto study tracks 2,309 tokens since 2013, including the ones that failed; in September 2026, 59 assets still had a market value above $1bn. COIN50 captures that layer without diluting the core: bitcoin and ether together make up 77.6% of the index, and every constituent is weighted by the value the market assigns it.
The 50% cap matters. Bitcoin’s dominance is about 60% of the crypto market today. Capping it at 50% at each review keeps the index anchored to bitcoin while ensuring that half of the exposure reflects the rest of the market. An index investor holds the same bitcoin core as a bitcoin ETF investor, plus the market built on top of it.
2,309 tokens tracked since 2013, including the ones that died |
59 assets with a market value above $1bn (Sept 2026) |
60% bitcoin dominance today, share of total crypto market cap |
50% the cap applied to bitcoin at each quarterly review |
|---|
3. Winners Rotate: You Can’t Pick Them in Advance
Static baskets decay. A benchmark has to renew itself.
Crypto’s leadership turns over faster than any equity market. Of the 100 largest assets in January 2018, only 15 are in the top 100 today. Across all start dates since 2016, about 64% of a top-100 cohort survives one year and only 25% survives five. Even the very top is not safe. Of the January 2018 top ten (Bitcoin, Ether, XRP, Bitcoin Cash, Cardano, Litecoin, Stellar, NEO, EOS and NEM), only Bitcoin, Ether and XRP are still in the top ten.
Figure 2: Static baskets decay: survivors of the January 2018 top 100
Source: MarketVector Indexes. Monthly market-cap ranks, stablecoins and wrapped tokens excluded. Count of the January 2018 top-100 cohort still ranked in the top 100 each January.
The equity parallel is the dot-com era. In March 2000 Cisco was the most valuable company in the world; by August 2025 its share price had still not recovered, while the Nasdaq-100 compounded more than fivefold. Investors who owned the index captured Amazon and Apple without having to pick them over Cisco.
COIN50 applies that discipline with quarterly reconstitution. In the last eight quarters the index made 26 constituent additions, from DeFi lending protocols (Morpho, Ethena) to new layer-1 networks (Aptos, Sei, Flare) and AI infrastructure (Bittensor, which entered in February 2026 and left again in May). The rules handle adding and removing names, so the investor does not have to.
How the buffer works At each review the 40 largest eligible assets are included automatically. The last 10 slots go first to existing constituents ranked 41–60, and only then to new names. This keeps turnover from tracking every short-term move in rankings while still letting persistent winners in, the same logic as the buffer zones used in equity benchmarks. |
|---|
4. The On-Chain Economy: Three Growth Engines, One Index
Stablecoins, tokenization and AI agents run on public networks. COIN50 owns those networks.
The strongest case for a broad index is not a bet on altcoins. It is that the real-world uses of crypto are growing on networks other than Bitcoin. Dollar stablecoins, tokenized funds and, increasingly, payments between AI agents all settle on smart-contract platforms and payment networks, and those networks earn fees, attract developers and capture value as usage grows. Stablecoins themselves are excluded from COIN50 by design, because they are pegged to the dollar. The index instead owns the infrastructure the stablecoins run on.
Figure 3: Stablecoins and tokenized funds have moved from experiment to scale
Source: Token Terminal. Month-end circulating market cap, native deployments, Jan 2021 to Oct 2026.
Stablecoins: the dollar goes on-chain
Stablecoin supply has grown from $34.5bn in January 2021 to $299bn in October 2026.
Adjusted for bot and exchange-internal flows, stablecoins moved about $9 trillion in 2025, up 87% year on year (a16z). With the GENIUS Act, dollar stablecoins become a regulated payment instrument in the United States. Ethereum hosts 54% of all stablecoin supply and Solana another 5%. Together with Ethereum scaling networks, about 60% of the stablecoin float sits on networks represented in COIN50.
Tokenization: Wall Street’s balance sheet moves on-chain
Tokenized money-market and Treasury funds grew from $3.5bn in January 2024 to $34.3bn today. Asset managers are issuing on public networks, not private ledgers. Ethereum hosts 44.5% of tokenized funds and stocks, followed by Solana (9.4%), Stellar (9.3%) and Avalanche (3.4%); all four are COIN50 constituents, as are Chainlink (data and interoperability) and XRP, Hedera and Algorand, which target institutional settlement.
AI × crypto: machines need money that is programmable
AI agents that buy data, compute or services need a way to pay that works without a bank account and in fractions of a cent. Stablecoins on public networks fit that need. The x402 standard, developed at Coinbase and contributed to the Linux Foundation in April 2026, lets software pay for an API call with a stablecoin, and Google’s Agent Payments Protocol supports it. Usage is early and some of the reported volume is test traffic, so we treat AI as an option rather than a driver today. Dedicated AI tokens such as NEAR, Render and Fetch.ai are already index constituents. If the theme scales, the settlement networks benefit first, and any AI tokens that grow large enough will enter the index through the normal rules.
Figure 4: Where COIN50’s Weight Sits Today
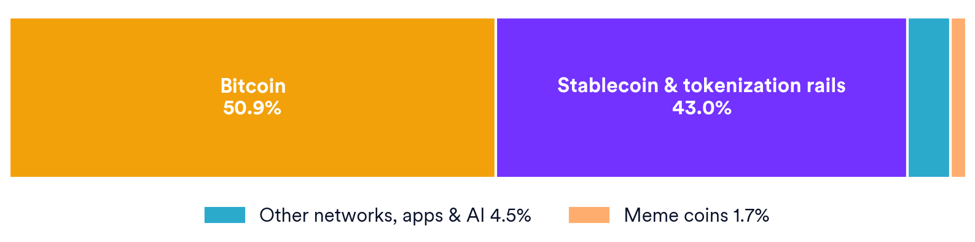
Source: MarketVector Indexes, MarketVector token taxonomy. Weights as of 21 Oct 2026. “Stablecoin & tokenization rails”: constituents tagged as hosting or servicing stablecoins or tokenized real-world assets (ETH, XRP, SOL, LINK, XLM, AVAX, HBAR, AAVE, QNT, ENA, SKY, ALGO, CRV, PENDLE).
Put differently, 43% of COIN50, or 88% of everything that is not bitcoin, is exposure to the infrastructure of on-chain dollars and tokenized assets.
Table 2: Three growth engines and how COIN50 holds them
Scale today |
Where it settles |
COIN50 constituents exposed |
Index weight |
$299bn supply, ~9x since Jan 2021; ~$9tn adjusted volume in 2025 |
Ethereum 54%, Solana 5%, Arbitrum 1% |
Networks: ETH, SOL, ARB, XLM, XRP. DeFi: AAVE, SKY, ENA, CRV, MORPHO |
41.4% |
$34bn tokenized funds, ~10x since Jan 2024 |
Ethereum 44.5%, Solana 9.4%, Stellar 9.3%, Avalanche 3.4% |
ETH, SOL, XLM, AVAX, XRP, HBAR, ALGO; data and interoperability: LINK, QNT; yield: PENDLE |
42.4% |
Early: x402 standard under the Linux Foundation since Apr 2026 |
Stablecoins on Ethereum and its scaling networks, and Solana |
AI infrastructure: NEAR, RENDER, FET (plus the settlement networks above) |
0.7% |
Source: Token Terminal (supply and chain shares, 22 Oct 2026), a16z State of Crypto 2025 (adjusted volume), MarketVector Indexes (weights, 21 Oct 2026). Constituent groups overlap; ETH, SOL, XLM and XRP appear in both of the first two rows.
What this means for an index investorOwning these growth engines through individual tokens would mean deciding today which networks win the stablecoin, tokenization and AI-payments markets. COIN50 holds the networks that lead today in proportion to their value, and its rules reweight them as the market decides. |
|---|
5. The Right Size: Why the Top 50? (Not the Top 500, Not the Top 10)
Breadth matters only where investors can actually trade.
More coins are not automatically better. Our State of Crypto study shows that in crypto the size premium isnegativeonce liquidity is required. Since 2014, MarketVector’s Large Cap index has compounded at 56% a year with a Sharpe ratio of 0.83. Mid and Small Cap compounded at roughly 33% with volatility above 90%, and Small Cap is still 97% below its all-time high. The famous small-cap premium appears only in equal-weighted portfolios nobody could trade; screened for the liquidity an institution needs, it turns into losses (−19% a year).
56% Large Cap CAGR since 2014 (Sharpe 0.83) |
33% Mid and Small Cap CAGR, with 90%+ volatility |
−97% Small Cap drawdown from its all-time high |
−19% CAGR of liquidity-screened small caps |
|---|
Source: MarketVector Indexes, Token Terminal, “The State of Crypto” (Sept 2026). Data as of 13 Sept 2026.
COIN50 sits at the liquid end of the market and is weighted the way the market is. Each network is held in proportion to its market value, so the index looks like the asset class itself rather than an equal-weighted basket of small tokens. That is why its risk profile stays close to the large-cap core: since 2020 its volatility (63%) has sat between bitcoin (57%) and ether (77%), and its maximum drawdown (−78%) has been in line with both.
What breadth adds is coverage. With 50 constituents across seven sectors, COIN50 represents about 90% of the value of the top-100 coins and reaches into every major part of the on-chain economy: payments, DeFi, data, AI infrastructure and the layer-1 and layer-2 networks that host them. It also holds the next generation before it arrives. A top-10 index can only buy a network once it has reached the top ten, by which time much of its rise has happened. COIN50 owns it on the way up, and market-cap weighting increases the position automatically as the network grows. Investors do not need to identify tomorrow’s leaders; the index is already holding them.
We also expect the balance of the index to change. Today’s weights reflect a market still priced mainly on bitcoin’s digital-gold narrative. Stablecoins, tokenization and AI-driven payments are pushing the asset class towards practical use cases, and the networks that carry them are where that usage, and the fees it generates, accrue. As this shift continues, we expect value, and with it index weight, to spread more widely across the constituents. Market-cap weighting means COIN50 follows that shift automatically, without the investor having to rebalance.
Table 3: Return/Risk
31 Dec 2020 – 21 Oct 2026 |
Coinbase 50 |
Bitcoin |
Ether |
|---|---|---|---|
Number of assets |
50 |
1 |
1 |
Total return |
+223.5% |
+191.2% |
+238.2% |
Annualised return |
22.4% |
20.2% |
23.4% |
Annualised volatility |
63.0% |
57.1% |
77.1% |
Return / risk |
0.36 |
0.35 |
0.30 |
Maximum drawdown |
−78.3% |
−76.7% |
−79.3% |
Weekly correlation to COIN50 |
1.00 |
0.90 |
0.91 |
Source: MarketVector Indexes. Daily data; return/risk = annualised return ÷ annualised volatility. COIN50 data prior to its 12 Nov 2024 launch is simulated.
6. Methodology: Built Like a Benchmark
Transparent rules, independent administration, institutional pricing.
Table 4: From the Coinbase Universe to 50 Constituents
1 |
Index universe |
All digital assets traded spot on Coinbase Exchange with at least one USD, USDC or USDT pair and covered by the pricing provider. |
|---|---|---|
2 |
Fundamental screen |
Token economics: no assets pegged to fiat, other digital assets or hard assets (stablecoins, wrapped tokens); no exchange coins; most supply in public circulation. Blockchain architecture: transparency, immutability, permissionless consensus, peer-to-peer. Security: no known critical vulnerabilities or undue 51%-attack exposure; custody available from Coinbase-approved custodians. |
3 |
Seasoning |
At least 360 days since the token generation event. |
4 |
Selection |
Rank by market cap. Top 40 qualify; remaining 10 slots go first to existing constituents ranked 41–60, then to the highest-ranked non-constituents. |
5 |
Weighting |
Market-cap weighted, with any single asset capped at 50% at each review. |
6 |
Maintenance |
Quarterly reviews in February, May, August and November; rebalanced at 17:00 CET on the last business day. Deleted constituents are replaced by the highest-ranked non-constituent. |
7 |
Pricing |
Volume-weighted average prices (VWAP) from whitelisted exchanges, calculated every second, with the closing value fixed at 17:00 CET. |
Source: Coinbase 50 Index Guide, version 1.03 (August 2026).
Figure 5: The 50 Constituents span seven sectors
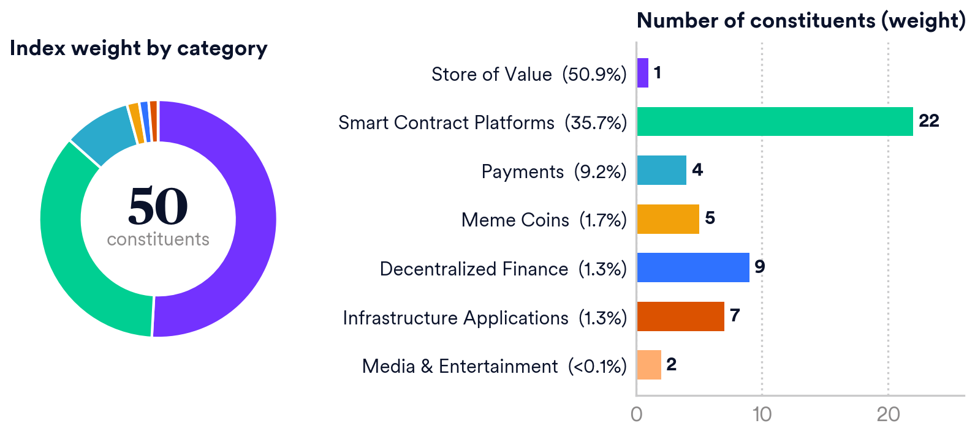
Source: MarketVector Indexes, MarketVector token taxonomy. Weights as of 21 Oct 2026.
Governance
The index is owned by Coinbase, Inc. and administered by MarketVector Indexes GmbH, an index administrator based in Frankfurt. MarketVector applies the IOSCO Principles for Financial Benchmarks and the governance framework built under the EU Benchmarks Regulation, including an independent oversight function, a documented discretion policy, 30-day notice for material methodology changes and an annual review of the index concept.
7. Performance & Risk: The Record Across a Full Cycle
Bitcoin-like risk, and a share of the rallies that broaden beyond bitcoin.
Figure 6: COIN50 against bitcoin and ether
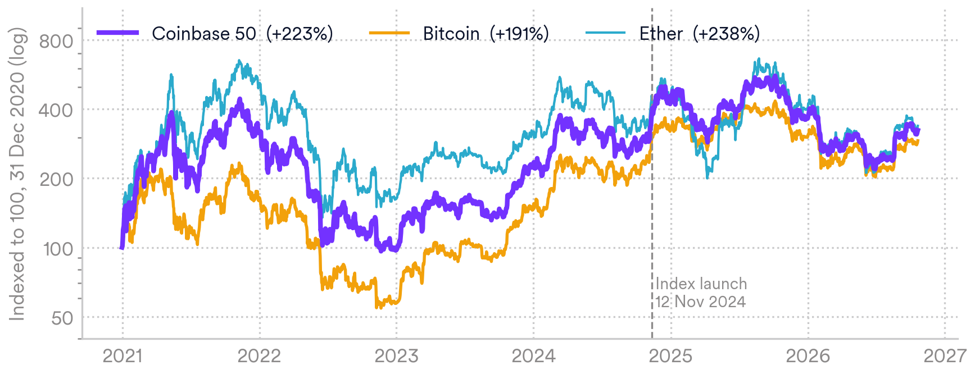
Source: MarketVector Indexes. Daily, 31 Dec 2020 to 21 Oct 2026. Data prior to 12 Nov 2024 is simulated.
Since December 2020, COIN50 has returned +224% against +191% for bitcoin, at slightly higher volatility (63% vs 57%) and a similar maximum drawdown. Measured monthly, it has captured 112% of bitcoin’s up months and 107% of its down months. The year-by-year record shows where the difference came from. In years when the market broadened, as in 2021, the index pulled well ahead. In bitcoin-led years (2023–2026) it trailed bitcoin while still rising strongly in 2023 and 2024. An investor does not need to predict which kind of year is coming: COIN50 holds bitcoin as its core and participates when the rest of the market leads.
Table 5: YTD & since launch to 21 October 2026
Calendar year |
2021 |
2022 |
2023 |
2024 |
2025 |
2026 YTD |
Since launch* |
|---|---|---|---|---|---|---|---|
Coinbase 50 |
+220.5% |
−69.5% |
+129.2% |
+94.8% |
−16.6% |
−11.2% |
−15.7% |
Bitcoin |
+59.5% |
−64.2% |
+155.8% |
+120.9% |
−6.5% |
−3.4% |
−4.2% |
Ether |
+398.6% |
−67.5% |
+90.9% |
+46.0% |
−11.0% |
−15.9% |
−23.2% |
Source: MarketVector Indexes. 2026 YTD and since launch to 21 Oct 2026. *Since COIN50 launch on 12 Nov 2024 (live performance). Earlier data is simulated.
Figure 7: Drawdowns: the cost of admission is the same
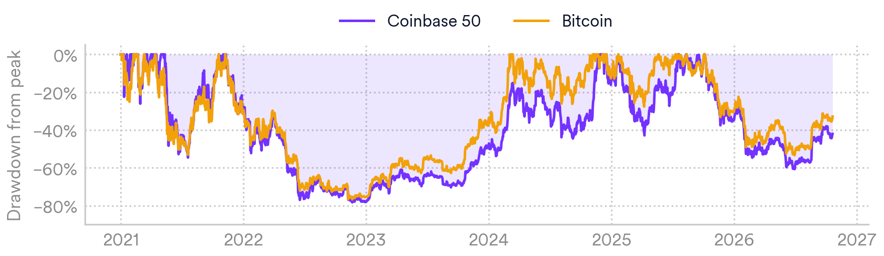
Source: MarketVector Indexes. Daily, 31 Dec 2020 to 21 Oct 2026.
8. In a Portfolio: A Small Allocation, A Measurable Difference
Five percent of a balanced portfolio, rebalanced quarterly.
Few investors will hold crypto on its own. The practical question is what a small allocation does to a diversified portfolio. We replaced five percentage points of the bond sleeve in a 60/40 portfolio (S&P 500 ETF / US aggregate bond ETF) with COIN50 or bitcoin, and rebalanced quarterly from December 2020.
Figure 8: Adding 5% crypto to a 60/40 portfolio
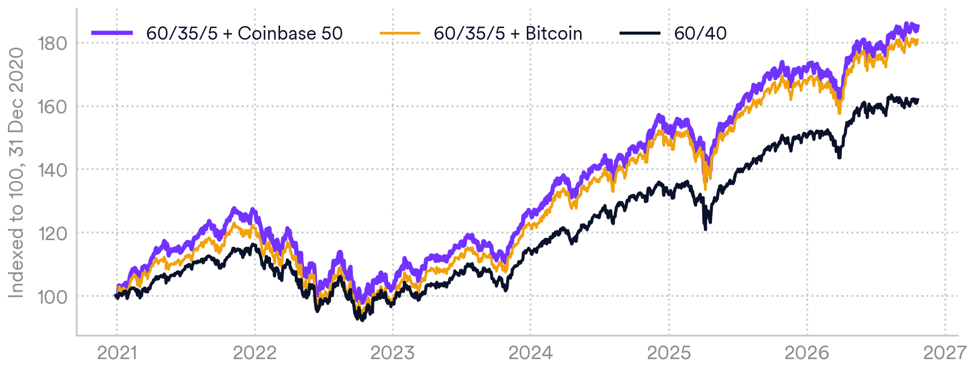
Source: MarketVector Indexes, SPY and AGG total-return price series. US trading days, 31 Dec 2020 to 21 Oct 2026, quarterly rebalancing. Hypothetical portfolios.
Table 6: Hypothetical, back-tested portfolios
31 Dec 2020 – 21 Oct 2026 |
60/40 |
60/35/5 + Bitcoin |
60/35/5 + COIN50 |
|---|---|---|---|
Total return |
+61.9% |
+80.8% |
+85.0% |
Annualised return |
8.7% |
10.7% |
11.2% |
Annualised volatility |
10.7% |
12.0% |
11.8% |
Return / risk |
0.81 |
0.90 |
0.95 |
Maximum drawdown |
−20.8% |
−23.7% |
−23.4% |
Source: MarketVector Indexes. Hypothetical, back-tested portfolios; they do not reflect fees, trading costs or taxes. COIN50 data prior to 12 Nov 2024 is simulated.
Over a period that includes the 2022 crash, a 5% COIN50 sleeve added about 2.5 percentage points a year and lifted return/risk from 0.81 to 0.95. The maximum drawdown rose by less than three points. The COIN50 sleeve also beat the bitcoin sleeve on both return and volatility, even though bitcoin outperformed COIN50 in most individual years since 2023. Quarterly rebalancing harvests the larger swings of a broader basket. COIN50’s weekly correlation was 0.27 to US equities and 0.03 to US bonds.
Where it fits
- Core crypto allocation: one position that represents the asset class, the way an S&P 500 fund represents US equities.
- Completion to a bitcoin holding: investors who already own bitcoin add the other half of the market without picking tokens.
- Benchmark for active managers: a transparent, investable yardstick for discretionary crypto mandates.
9. Frequently Asked Questions
Is a 50-coin index with 50% bitcoin really diversified?
It is as diversified as the market. Bitcoin and ether are 78% of COIN50 because they are the majority of crypto’s value. The cap keeps bitcoin from going above 50% at each review, below its market share of about 60%. Concentration at the top is also normal for equity benchmarks.
Why are stablecoins excluded if they are a key growth driver?
A stablecoin is pegged to the dollar, so it adds no return and would only dilute the index.
COIN50 owns the networks stablecoins settle on (Ethereum, Solana, Stellar and others) and the DeFi protocols that use them.
How often does the index change?
Quarterly, in February, May, August and November. In the last eight quarters there were 26 additions. A 41–60 buffer keeps existing constituents from being dropped over small changes in rank.
How is the index priced?
With volume-weighted prices from a whitelist of exchanges assessed on liquidity, data quality, regulation and technology. The closing value is fixed daily at 17:00 CET.
Is COIN50 just a leveraged bet on altcoins?
No. Its volatility (63%) sits between bitcoin (57%) and ether (77%), and its drawdowns have closely tracked bitcoin’s. Bitcoin and ether alone make up more than three-quarters of the index.
10. Conclusion
Crypto no longer needs to be explained one coin at a time. The asset class has a reserve asset in bitcoin, a growing payment layer in stablecoins, an institutional on-ramp in tokenization and an early role in machine-to-machine payments. An investor needs a benchmark that holds all of it, in proportion, and renews itself as the market changes. The S&P 500 did that for US equities. The Coinbase 50 is built to do it for digital assets.
Don't look for the needle in the haystack. Just buy the haystack.
John C. Bogle, Founder of Vanguard
Appendix: Coinbase 50 Constituents
Table 7: Index weights as of 21 October 2026
# |
Constituent |
Weight |
# |
Constituent |
Weight |
# |
Constituent |
Weight |
|---|---|---|---|---|---|---|---|---|
1 |
Bitcoin (BTC) |
50.87% |
18 |
Ethena (ENA) |
0.18% |
35 |
VeChain (VET) |
0.06% |
2 |
Ether (ETH) |
26.70% |
19 |
Polkadot (DOT) |
0.18% |
36 |
Curve (CRV) |
0.05% |
3 |
XRP (XRP) |
7.67% |
20 |
Pepe (PEPE) |
0.17% |
37 |
Celestia (TIA) |
0.05% |
4 |
Solana (SOL) |
5.57% |
21 |
Mantle (MNT) |
0.16% |
38 |
Flare (FLR) |
0.05% |
5 |
Dogecoin (DOGE) |
1.15% |
22 |
Sky (SKY) |
0.16% |
39 |
Pudgy Penguins (PENGU) |
0.05% |
6 |
Chainlink (LINK) |
0.83% |
23 |
Internet Computer (ICP) |
0.15% |
40 |
Fetch.ai (FET) |
0.04% |
7 |
Cardano (ADA) |
0.74% |
24 |
Morpho (MORPHO) |
0.14% |
41 |
Sei (SEI) |
0.04% |
8 |
NEAR Protocol (NEAR) |
0.61% |
25 |
Arbitrum (ARB) |
0.11% |
42 |
Pendle (PENDLE) |
0.03% |
9 |
Stellar (XLM) |
0.57% |
26 |
Ethereum Classic (ETC) |
0.11% |
43 |
Tezos (XTZ) |
0.03% |
10 |
Bitcoin Cash (BCH) |
0.51% |
27 |
Polygon (POL) |
0.09% |
44 |
Lido DAO (LDO) |
0.03% |
11 |
Litecoin (LTC) |
0.43% |
28 |
Algorand (ALGO) |
0.09% |
45 |
Immutable (IMX) |
0.03% |
12 |
Uniswap (UNI) |
0.42% |
29 |
Render (RENDER) |
0.09% |
46 |
Bonk (BONK) |
0.02% |
13 |
Avalanche (AVAX) |
0.37% |
30 |
Cosmos (ATOM) |
0.08% |
47 |
The Graph (GRT) |
0.02% |
14 |
Hedera (HBAR) |
0.33% |
31 |
Injective (INJ) |
0.08% |
48 |
JasmyCoin (JASMY) |
0.02% |
15 |
Shiba Inu (SHIB) |
0.27% |
32 |
ether.fi (ETHFI) |
0.07% |
49 |
Decentraland (MANA) |
0.02% |
16 |
Aave (AAVE) |
0.21% |
33 |
Aptos (APT) |
0.06% |
50 |
Chiliz (CHZ) |
0.01% |
17 |
Quant (QNT) |
0.21% |
34 |
Stacks (STX) |
0.06% |
|
|
|
Source: MarketVector Indexes.
Data Sources and Notes
- Index levels: MarketVector Indexes (Coinbase 50). Coin prices: MarketVector Indexes. Coinbase 50 launched on 12 November 2024; earlier values are simulated (back-tested) using the index methodology.
- Return/risk is annualised return divided by annualised volatility (no risk-free rate). Volatility is annualised from daily returns (365 days for crypto, 252 for portfolios). Correlations use weekly (Friday) returns.
- Bitcoin dominance: MarketVector Indexes. Survival analysis: MarketVector top-100 universe, monthly ranks by market cap, stablecoins and wrapped tokens excluded.
- Stablecoin supply, tokenized funds and chain shares: Token Terminal, circulating market cap of native deployments, as of 22 October 2026. Adjusted stablecoin volume: a16z, State of Crypto 2025.
- Size-factor statistics: MarketVector Indexes, “The State of Crypto” (September 2026). Bitcoin ETF assets: industry flow trackers, mid-October 2026.
- Regulation: GENIUS Act (Pub. L. 119-27, July 2025); SEC approval of generic listing standards (Sept 2025); SEC–CFTC joint interpretive release (17 March 2026).
- Portfolio analysis: SPY and AGG adjusted closing prices, US trading days only, quarterly rebalancing, no costs. Hypothetical results for illustration only.
View PDF >
About the Author(s):
Martin Leinweber leads digital asset research and strategy at MarketVector Indexes, where he develops index products, publishes institutional research, and serves as the firm's primary voice on crypto markets to a global client base. His work sits at the intersection of systematic investing and an emerging asset class, translating rigorous quantitative frameworks into actionable insight for institutional investors. Before joining MarketVector, Martin spent nearly two decades as a Portfolio Manager across equities, fixed income, and alternative investments. At Quoniam Asset Management, one of Germany's foremost quantitative houses, he managed active funds for institutional clients including insurance companies, pension funds, and sovereign wealth funds. Earlier in his career at MEAG, the asset manager of Munich Re and ERGO, he contributed to the firm's international expansion, including the establishment of a joint venture with PICC, China's largest insurance company, with operations in Shanghai and Beijing. Martin is co-author of two Wiley publications: Asset-Allokation mit Kryptoassets: Das Handbuch (2021), the first institutional handbook on integrating digital assets into traditional portfolios, and Mastering Crypto Assets: Investing in Bitcoin, Ethereum, and Beyond (2024). He holds a Master of Economics from the University of Hohenheim and is a CFA Charterholder.
IMPORTANT DEFINITIONS AND DISCLOSURES
Copyright © 2026 by MarketVector Indexes GmbH (‘MarketVector’) All rights reserved. The MarketVector family of indexes (MarketVectorTM, Bluestar®, MVIS®) is protected through various intellectual property rights and unfair competition and misappropriation laws. MVIS® is a registered trademark of Van Eck Associates Corporation that has been licensed to MarketVector. MarketVectorTM and MarketVector IndexesTM are pending trademarks of Van Eck Associates Corporation. BlueStar®, BlueStar Indexes®, BIGI®, and BIGITech® are trademarks of MarketVector Indexes GmbH.
Redistribution, reproduction, and/or photocopying in whole or in part are prohibited without written permission. All information provided by MarketVector is impersonal and not tailored to the needs of any person, entity, or group of persons. MarketVector receives compensation in connection with licensing its indexes to third parties. You require a license from MarketVector to launch any product that is linked to a MarketVectorTM Index to use the index data for any business purpose and all use of the MarketVectorTM name or name of the MarketVectorTM Index. The past performance of an index is not a guarantee of future results.
It is not possible to invest directly in an index. Exposure to an asset class represented by an index is available through investable instruments based on that index. MarketVector does not sponsor, endorse, sell, promote, or manage any investment fund or other investment vehicle that is offered by third parties and that seeks to provide an investment return based on the performance of any index. MarketVector makes no assurance that investment products based on the index will accurately track index performance or provide positive investment returns. MarketVector is not an investment advisor, and it makes no representation regarding the advisability of investing in any such investment fund or other investment vehicle. A decision to invest in any such investment fund or other investment vehicle should not be made in reliance on any of the statements set forth in this document.
Investments into cryptocurrencies and/or digital assets are subject to material and high risk including the risk of total loss. The calculated prices may not be achieved by investors as the calculated price is based on prices from different trading platforms. Furthermore, an investment into cryptocurrencies and/or digital assets may become illiquid depending on the trading platform or investment product used for the specific investment. Investors should carefully review all risk factors disclosed by the relevant trading platform or in the product documents of relevant investment products.
Prospective investors are advised to make an investment in any such fund or other vehicle only after carefully considering the risks associated with investing in such funds, as detailed in an offering memorandum or similar document that is prepared by or on behalf of the issuer of the investment fund or other vehicle. The inclusion of a security within an index is not a recommendation by MarketVector to buy, sell, or hold such security, nor is it considered to be investment advice.
All information shown prior to the index launch date is simulated performance data created from backtesting ("Simulated past performance”). Simulated past performance is not actual but hypothetical performance based on the same or fundamentally the same methodology that was in effect when the index was launched. Simulated past performance may materially differ from the actual performance. Actual or simulated past performance is no guarantee for future results.
These materials have been prepared solely for informational purposes based upon information generally available to the public from sources believed to be reliable. No content contained in these materials (including index data, ratings, credit-related analyses and data, model, software, or other application or output therefrom) or any part thereof (Content) may be modified, reverse-engineered, reproduced or distributed in any form by any means, or stored in a database or retrieval system, without the prior written permission of MarketVector. The Content shall not be used for any unlawful or unauthorized purposes. MarketVector and its third-party data providers and licensors (collectively “MarketVector Parties”) do not guarantee the accuracy, completeness, timeliness, or availability of the Content. MarketVector Parties are not responsible for any errors or omissions, regardless of the cause, for the results obtained from the use of the Content. THE CONTENT IS PROVIDED ON AN “AS IS” BASIS. MARKETVECTOR PARTIES DISCLAIM ANY AND ALL EXPRESS OR IMPLIED WARRANTIES, INCLUDING, BUT NOT LIMITED TO, ANY WARRANTIES OF MERCHANTABILITY OR FITNESS FOR A PARTICULAR PURPOSE OR USE, FREEDOM FROM BUGS, SOFTWARE ERRORS, OR DEFECTS, THAT THE CONTENT’S FUNCTIONING WILL BE UNINTERRUPTED OR THAT THE CONTENT WILL OPERATE WITH ANY SOFTWARE OR HARDWARE CONFIGURATION. In no event shall MarketVector Parties be liable to any party for any direct, indirect, incidental, exemplary, compensatory, punitive, special, or consequential damages, costs, expenses, legal fees, or losses (including, without limitation, lost income or lost profits and opportunity costs) in connection with any use of the Content even if advised of the possibility of such damages.
Get the latest news & insights from MarketVector
Get the newsletterRelated: