Abstract
Europe's nuclear sector has moved from a phase-out story to an energy-security and industrial-policy story. This note frames that change through six defining moments — the post-Fukushima retreat, the 2022 energy shock, nuclear's inclusion in the EU Taxonomy, Germany's EU-level policy shift, EU aid to Poland for a new nuclear powerplant, and the March 2026 EU strategy for small modular reactors — and asks whether the shift is not only a policy theme, but an indexable investment theme. The evidence suggests a clear opening: existing nuclear indexes are global, while the European buildout requires a regional, investable, and UCITS-aware index design. A backtest of four European nuclear index variants shows that range-tier weighting improves the return and drawdown profile versus modified free-float market-cap weighting, while preserving a distinct mandate from global nuclear benchmarks.
1. The Structural Shift
The starting observation is simple: macro forces are creating new investable themes faster than traditional classification systems can describe them. Geopolitical realignment, supply-chain independence, industrial policy, AI infrastructure, and energy security are no longer background variables. They are becoming the drivers of capital expenditure and portfolio demand. European nuclear energy is a clean example of that shift, because the investment case is not only about uranium prices or utility dividends. It is about a regional policy reversal, a power-demand cycle, and a security-of-supply requirement arriving at the same time.
The policy sequence matters. In 2011, Germany's post-Fukushima exit marked the high point of Europe's anti-nuclear direction. In February 2022, Russia's invasion of Ukraine transformed the energy debate from climate-only to security-and-resilience. The European Commission's REPowerEU plan was introduced in response to the energy disruption caused by the invasion and to phase out Russian fossil-fuel imports[1]. That change in policy urgency was reinforced by the EU Taxonomy's Complementary Climate Delegated Act, which added specific nuclear and gas activities under strict conditions and has applied since January 2023[2]. By March 2026, the Commission had adopted an SMR strategy designed to accelerate small modular and advanced modular reactors, with first European projects targeted for the early 2030s and preliminary EU capacity estimates of 17–53 GW by 2050[3].
We summarize this sequence as a transition from fracture to shock, rehabilitation, consensus, investment, and strategy. The investable implication is that nuclear in Europe is no longer simply a legacy baseload asset. It is tied to AI data-center demand, industrial electrification, green finance eligibility, energy sovereignty, and the renewal of domestic supply chains. The European Commission's 8th Nuclear Illustrative Programme puts EU nuclear investment needs at EUR 241 billion to 2050, with additional support required for SMR development[3]. That is large enough to justify a dedicated thematic index question: can the European-listed universe provide focused exposure to the buildout?
2. The Indexing Gap
Our review of the nuclear index landscape has reached a simple conclusion: as of this writing, we are not aware of any index focused exclusively on European nuclear energy. Existing products and benchmarks capture nuclear through global uranium mining, global nuclear components, broad nuclear infrastructure, or general European utility exposure. That creates useful exposure, but not the exposure implied by the European policy thesis.
The distinction is important. Global nuclear indexes naturally gravitate toward names such as Cameco, Constellation Energy, Paladin, and Kazatomprom. Some include European utilities, engineering firms, or physical uranium vehicles, but the European weight is incidental. Broad European utility indexes have the opposite problem: they contain companies with nuclear assets, but nuclear is diluted by non-nuclear generation, networks, and broader regulated utility exposure. Neither design isolates the European nuclear buildout as the central portfolio question.
This is where the indexing problem becomes practical. Sector classifications describe what a company is today. Revenue thresholds describe what a company does today. Market-cap weighting describes what the market already values. A forward-looking nuclear theme needs a broader lens: current nuclear revenue, patent or technology relevance, and ecosystem positioning across utilities, fuel, engineering, construction, services, and next-generation reactor exposure.
3. MarketVector™ Methodology Concept
The proposed index concept starts with a European-listed and Europe-registered universe, then applies investability screens: three-month average daily trading volume above USD 500,000, free float above 10%, and market capitalization above USD 150 million. The test index targets 20 components, selected through three complementary rules. Companies ranked in the top 15 by free-float market capitalization qualify automatically. Existing constituents ranked 15–25 are retained through a buffer zone designed to reduce turnover. For country floor variant, at least one company per country in the universe is included, preserving the regional breadth of the theme.
Two weighting approaches are then compared. Modified FFMCap weighting follows traditional benchmark logic: free-float market capitalization with rank-based concentration caps of 15% for the largest component, 10% for the second, and 8% thereafter. Range-tier weighting is the thematic alternative: it allocates across seven nuclear value-chain themes — such as the nuclear fuel cycle, reactor engineering and construction, and enabling technologies and services and weights companies by market capitalization within each theme, and applies classification multipliers that enhance pure-play exposure. Together with the selection methodologies, this creates four European nuclear variants.
Three companies illustrate why a multi-lens universe matters. Yellow Cake represents direct uranium exposure that a revenue screen identifies immediately. Rolls-Royce represents patent and SMR technology relevance that revenue alone would miss. ČEZ represents a paradigm case: a utility operator, a strategic SMR shareholder, and a likely customer for new capacity at the same time. The index design is therefore not just a list of nuclear companies. It is an attempt to translate the European nuclear value chain into an investable portfolio.
4. Backtest Results
The backtest compares the four European nuclear variants with the MarketVector™ Global Uranium & Nuclear Energy Index (MVNLR), the MarketVector™ Global Uranium and Nuclear Energy Infrastructure Index (MVNUCL), and the broad MarketVector™ global equity benchmark (MVIGE). The cumulative history runs from 31 December 2020 to 30 April 2026; MVNUCL is measured from its base date of 31 December 2021. All statistics have been calculated since inception.
Figure 1: Cumulative total return
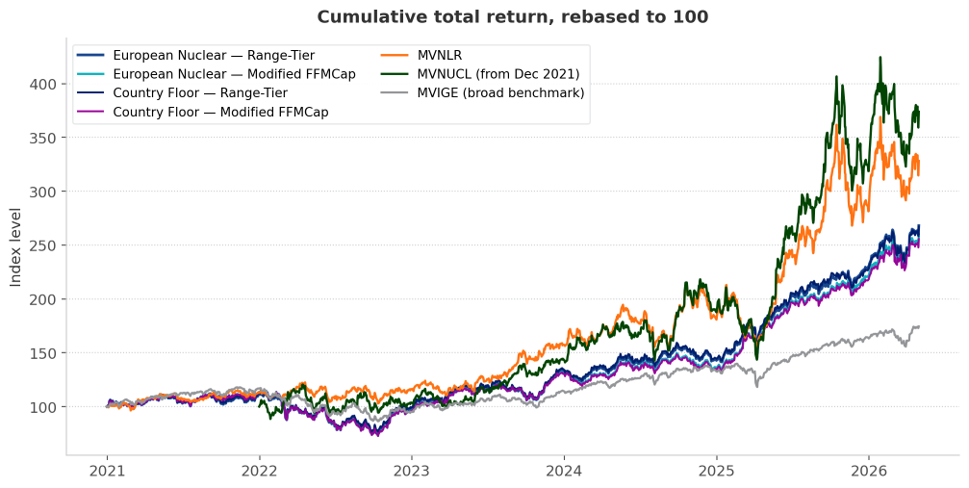
Cumulative total return, rebased to 100 at each series' inception. Source: MarketVector Indexes; data as of 30 April 2026.
Table 1: Performance Statistics
Index |
Total Return |
Ann. Return |
Ann. Vol |
Sharpe |
Sortino |
Max DD |
IR |
Top 15 Buffer 25 Modified FFMCap |
158.1% |
18.9% |
19.0% |
1.01 |
1.38 |
-37.1% |
-0.47 |
Top 15 Buffer 25 Range-Tier |
168.1% |
19.8% |
19.4% |
1.03 |
1.46 |
-33.4% |
-0.43 |
Country Floor Modified FFMCap |
155.6% |
18.7% |
19.0% |
1.00 |
1.36 |
-37.2% |
-0.48 |
Country Floor Range-Tier |
167.0% |
19.7% |
19.2% |
1.03 |
1.46 |
-33.4% |
-0.44 |
228.1% |
24.3% |
23.8% |
1.03 |
1.49 |
-29.8% |
-0.53 |
|
74.4% |
10.7% |
13.1% |
0.84 |
1.17 |
-26.8% |
-0.99 |
|
273.9% |
34.6% |
29.9% |
1.14 |
1.80 |
-34.2% |
— |
Performance statistics, since inception. Information Ratio (IR) is calculated relative to MVNUCL. MVNUCL statistics are measured from its later base date (31 December 2021). Source: MarketVector Indexes.
The result is not that a European nuclear index dominates every global nuclear benchmark— it does not. MVNUCL and MVNLR show higher absolute returns because they capture the global uranium and nuclear story, including non-European mega-cap exposure and broader nuclear infrastructure. The more useful conclusion is that the European nuclear variants answer a different mandate. They isolate European-listed exposure and still produce thematic equity returns with Sharpe ratios around or above 1.0, materially ahead of the broad MVIGE benchmark at 0.84.
The weighting result is especially relevant. Range-tier weighting generated 168.1% total return and a -33.4% maximum drawdown, compared with 158.1% and -37.1% for modified FFMCap. The country-floor range-tier version was nearly identical at 167.0% total return and the same -33.4% maximum drawdown. The evidence therefore supports the claim that weighting design is a performance variable; it changes which companies matter, how much pure-play exposure survives, and how the portfolio behaves in drawdowns.
5. Discussion
The investment case is strongest when framed as complementary exposure. A global nuclear index is appropriate for investors seeking maximum nuclear beta. A European nuclear index is appropriate for investors who want the regional buildout, European-listed implementation, and a UCITS-oriented construction logic. That distinction avoids the wrong comparison. The question is not whether European nuclear beats global nuclear in every period. The question is whether Europe's policy and capital-expenditure cycle can be captured in a product that existing global indexes do not provide.
The main limitation is universe size. Europe has fewer listed nuclear pure plays than North America, Australia, or Kazakhstan, and EDF's renationalization removed a major historical name from public markets. This makes index construction more dependent on hybrid companies: utilities with nuclear fleets, engineering firms with reactor exposure, fuel-cycle companies, SMR technology owners, and physical uranium vehicles. The design must balance thematic purity against investability. Liquidity thresholds, single-name caps, country diversification, and turnover buffers are not secondary details — they are what make the theme implementable.
The second limitation is that this is a backtest. Past performance and index simulation do not guarantee future returns, and nuclear policy remains exposed to permitting delays, cost overruns, elections, uranium-price cycles, and public acceptance. Still, the backtest is useful because it shows that the methodology choices are measurable. Range-tier weighting appears to improve the risk-return profile relative to modified market-cap weighting while preserving the European mandate.
Conclusion
European nuclear energy is, albeit slow, becoming an indexable theme, because policy, energy security, power demand, and industrial strategy are now pointing in the same direction. Our competitive review identifies a clear market gap: nuclear indexes exist, but they are global; European utility indexes exist, but nuclear exposure is incidental. The proposed MarketVector approach fills that gap by combining European-listed eligibility, investability screens, a turnover-aware selection design targeting 20 components, and weighting methods that can express either market size or thematic conviction.
The backtest supports the core thesis. European nuclear range-tier weighting produced stronger total return and a shallower maximum drawdown than modified market-cap weighting, while all European nuclear variants delivered Sharpe ratios above the broad MVIGE benchmark. The result is not a replacement for global nuclear exposure, but a distinct tool for investors seeking the European buildout specifically. Fifteen years ago, Europe was closing reactors. Today it is committing hundreds of billions of euros to build new ones.
Sources
[1] European Commission, REPowerEU: https://commission.europa.eu/topics/energy/repowereu_en
[2] European Commission, EU taxonomy for sustainable activities, Complementary Climate Delegated Act: https://finance.ec.europa.eu/sustainable-finance/tools-and-standards/eu-taxonomy-sustainable-activities_en
[3] European Commission, EU strategy for small modular reactors (COM/2026/117) and 8th Nuclear Illustrative Programme (PINC): https://energy.ec.europa.eu/topics/nuclear-energy/small-modular-reactors_en
[4] MarketVector Indexes, backtested index data and methodology specifications, as of 30 April 2026.
Past performance and backtested index data do not guarantee future results. Backtested performance is hypothetical, does not reflect an investable product, and is shown for illustrative purposes only. This research note is for informational purposes and is not investment advice.
About the Author(s):
For informational and advertising purposes only. The views and opinions expressed are those of the authors but not necessarily those of MarketVector Indexes GmbH. Opinions are current as of the publication date and are subject to change with market conditions. Certain statements contained herein may constitute projections, forecasts, and other forward-looking statements that do not reflect actual results. It is not possible to invest directly in an index. Exposure to an asset class represented by an index is available through investable instruments based on that index. MarketVector Indexes GmbH does not sponsor, endorse, sell, promote, or manage any investment fund or other investment vehicle that is offered by third parties and that seeks to provide an investment return based on the performance of any index. The inclusion of a security within an index is not a recommendation by MarketVector Indexes GmbH to buy, sell, or hold such security, nor is it considered to be investment advice.
Get the latest news & insights from MarketVector
Get the newsletterRelated:
Most popular
-
 Commentary
How Rising Rates Can Impact Equity Returns
-
 Commentary
The Space Economy Is Taking Off